Fig. 4
Download original image
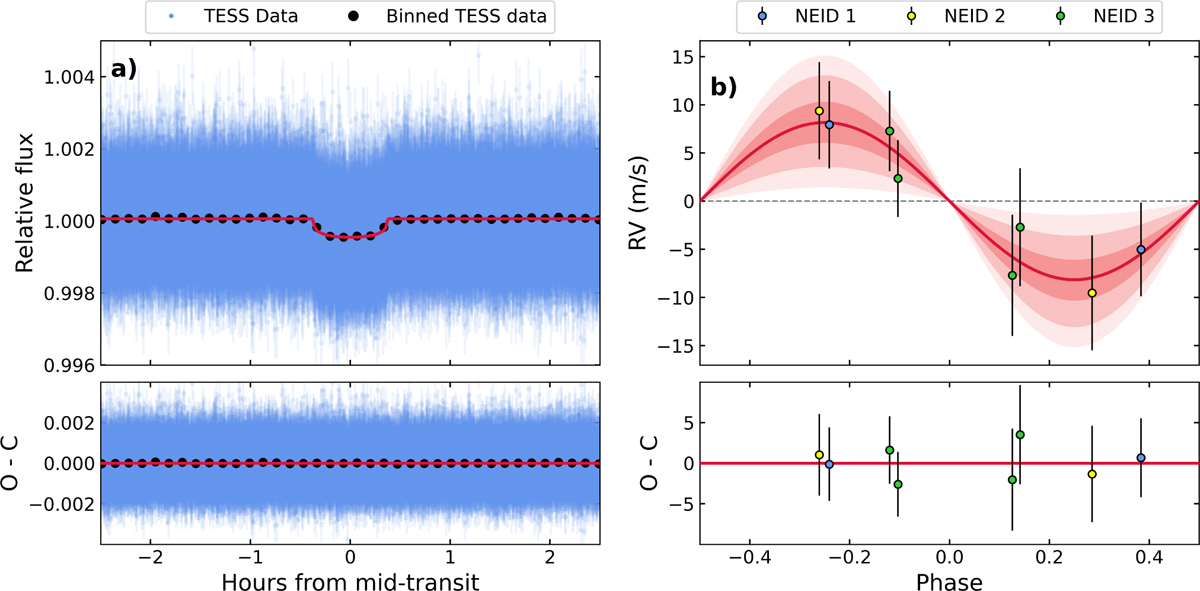
Best-fit results from a joint transit and RV fit using the FCO method for the RV data. a) Detrended TESS photometric observations (2 min exposures) are shown in blue at the top, folded on the time of transit. Best-fit transit model is shown in red. The black points show the TESS data binned to a cadence of 2 min. Residuals from the best-fit model are shown at the bottom. b) Phase-folded RV data and best-fit model (red) of TOI-2431 as observed with NEID in three separate visits listed as NEID1 (blue), NEID2 (yellow), and NEID3 (green), shown at the top. The red-shaded regions show the 1, 2, and 3σ credible intervals of the best-fitting model. Residuals from the best-fit model on the bottom. We adopted the values from this fit as the values for TOI-2431 b.
Current usage metrics show cumulative count of Article Views (full-text article views including HTML views, PDF and ePub downloads, according to the available data) and Abstracts Views on Vision4Press platform.
Data correspond to usage on the plateform after 2015. The current usage metrics is available 48-96 hours after online publication and is updated daily on week days.
Initial download of the metrics may take a while.