Fig. 5
Download original image
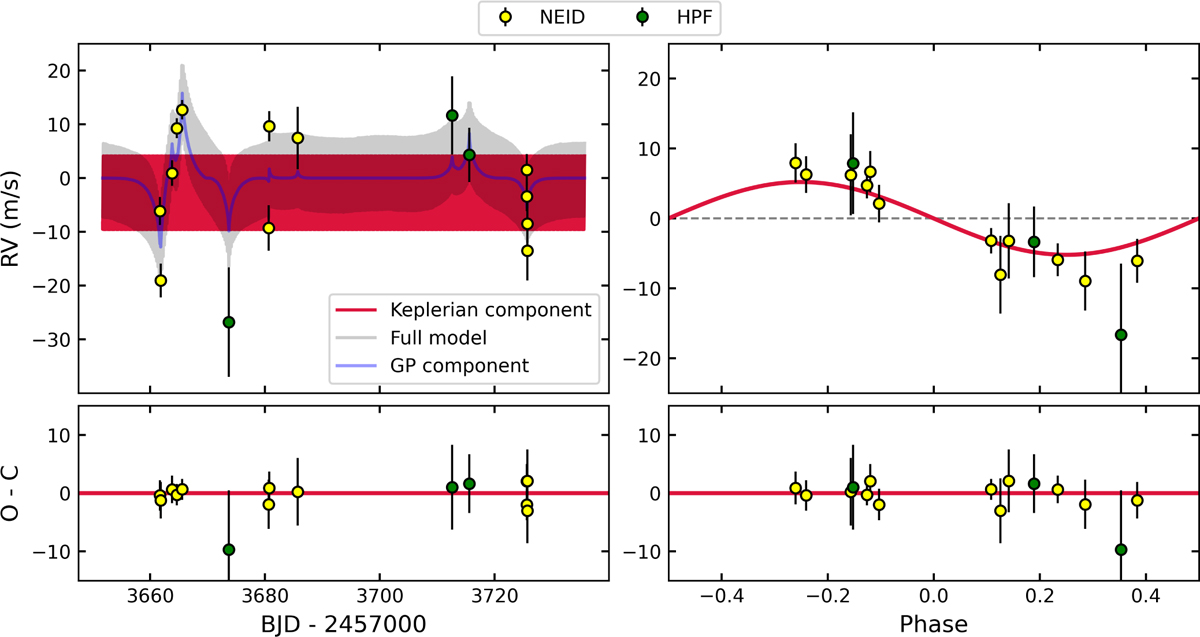
Best fit results from a joint transit and RV fit using a quasi-periodic GP model to account for the excess RV scatter in the RVs. a) NEID (yellow) and HPF (green) RVs as a function of time at the top. The best-fit Keplerian model is shown in red (appears as a solid band due to the short period orbit). The median of the GP component is shown in blue. The joint best-fit model is shown in grey. Residuals from the best fit model, shown at the bottom. b) Phase-folded RVs on the period of TOI-2431 b, shown at the top. Best-fit Keplerian model after subtracting the GP model is in red. RV residuals as a function of phase are shown at the bottom.
Current usage metrics show cumulative count of Article Views (full-text article views including HTML views, PDF and ePub downloads, according to the available data) and Abstracts Views on Vision4Press platform.
Data correspond to usage on the plateform after 2015. The current usage metrics is available 48-96 hours after online publication and is updated daily on week days.
Initial download of the metrics may take a while.