Fig. 6
Download original image
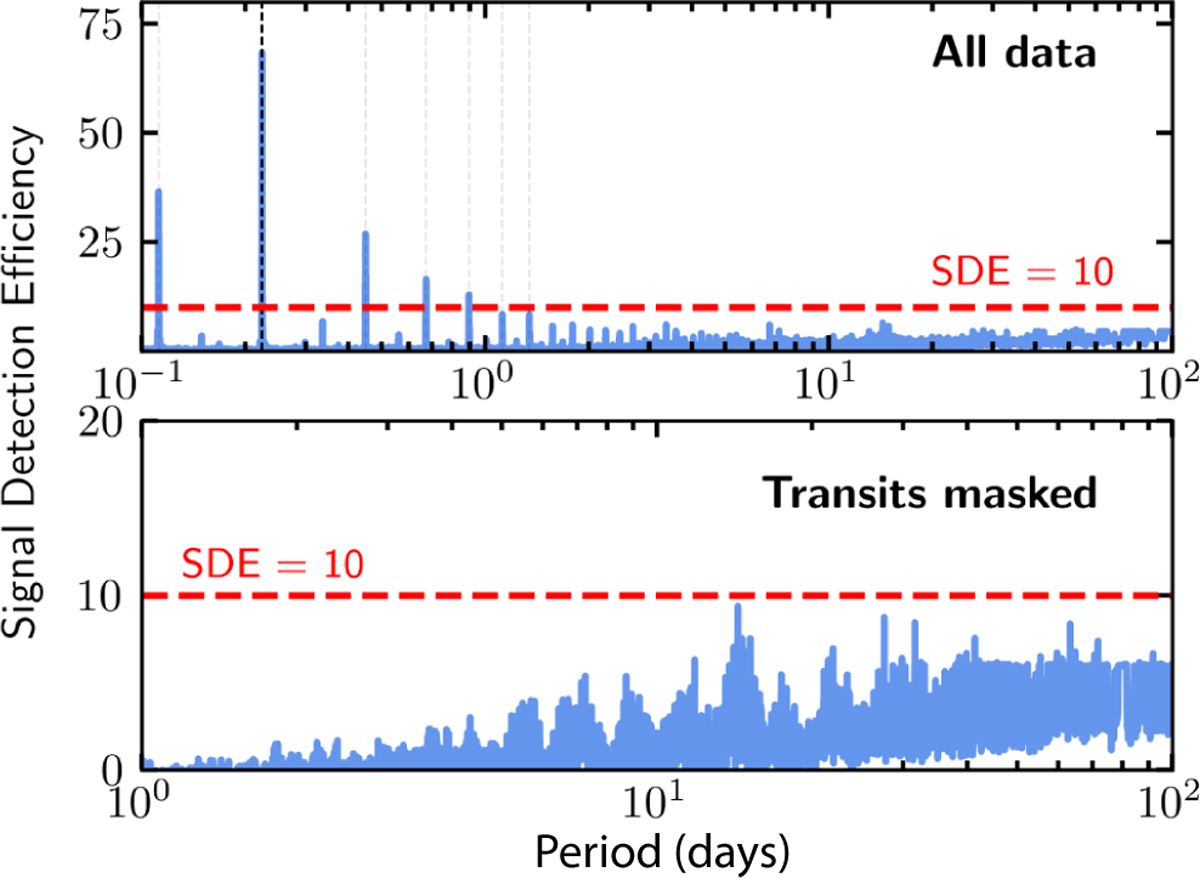
BLS periodogram of the TESS data. Top: BLS periodogram of all of the TESS sectors. The highest peak reveals the period of TOI-2431 b of 0.22 days, which is highlighted with the black dashed vertical line. Aliases of this period are also shown as faint dashed lines. The horizontal red dashed line shows a SDE of 10, the threshold we adopt for a significant signal. Bottom: BLS periodogram of the TESS data after masking out the transits of TOI-2431 b. No significant peaks are detected.
Current usage metrics show cumulative count of Article Views (full-text article views including HTML views, PDF and ePub downloads, according to the available data) and Abstracts Views on Vision4Press platform.
Data correspond to usage on the plateform after 2015. The current usage metrics is available 48-96 hours after online publication and is updated daily on week days.
Initial download of the metrics may take a while.