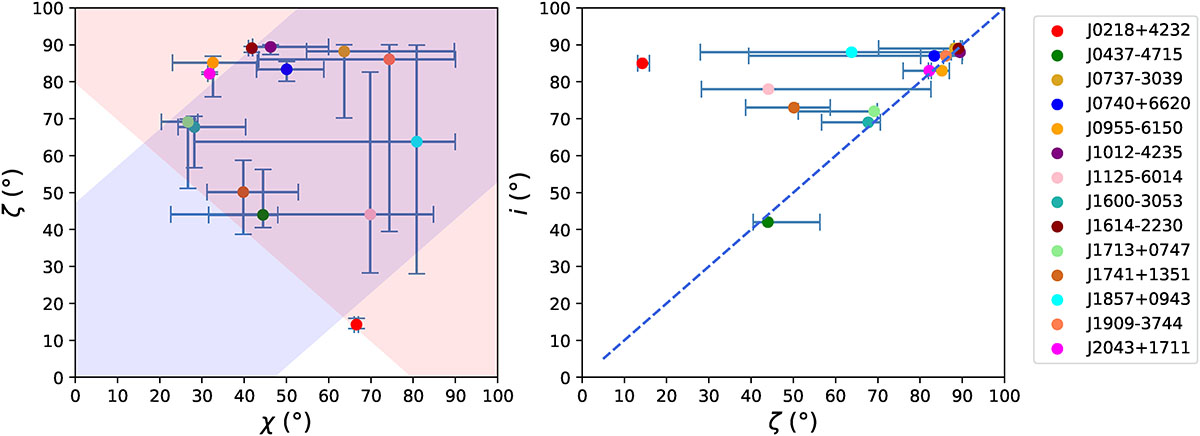
Fig. 3.
Download original image
Left: χ−ζ plane showing the best-fit couple of angles χ and ζ for the first sample of MSPs. Right: ζ − i plane showing the best-fit angle, ζ, for the inclination, i, imposed by Shapiro delay measurements, with the blue dotted line corresponding to the perfect alignment condition i = ζ. Individual pulsars are depicted by different colours.
Current usage metrics show cumulative count of Article Views (full-text article views including HTML views, PDF and ePub downloads, according to the available data) and Abstracts Views on Vision4Press platform.
Data correspond to usage on the plateform after 2015. The current usage metrics is available 48-96 hours after online publication and is updated daily on week days.
Initial download of the metrics may take a while.