| Issue |
A&A
Volume 707, March 2026
|
|
|---|---|---|
| Article Number | A247 | |
| Number of page(s) | 10 | |
| Section | Galactic structure, stellar clusters and populations | |
| DOI | https://doi.org/10.1051/0004-6361/202556472 | |
| Published online | 17 March 2026 | |
Discovery of two new millisecond pulsars toward the Galactic bulge
1
NASA Goddard Space Flight Center,
Code 662,
Greenbelt,
MD
20771,
USA
2
University of Maryland, Department of Astronomy,
College Park,
MD
20742,
USA
3
LAPTh, CNRS, USMB,
74940
Annecy,
France
4
Université Grenoble Alpes, CNRS, IPAG,
38000
Grenoble,
France
5
Australia Telescope National Facility, CSIRO, Space and Astronomy,
PO Box 76,
Epping,
NSW
1710,
Australia
6
Western Sydney University,
Locked Bag 1797,
Penrith South DC,
NSW
2751,
Australia
7
George Mason University, resident at the Naval Research Laboratory,
Washington,
DC
20375,
USA
8
Department of Engineering and Physics, Sweet Briar College,
Sweet Briar,
VA
24595,
USA
9
National Radio Astronomy Observatory,
PO Box O,
Socorro,
NM
87801,
USA
10
Fakultät für Physik, Universität Bielefeld,
Postfach 100131,
33501
Bielefeld,
Germany
11
National Radio Astronomy Observatory,
520 Edgemont Rd.,
Charlottesville,
VA
22903,
USA
12
INAF - Osservatorio Astronomico di Cagliari,
Via della Scienza 5,
09047
Selargius (CA),
Italy
13
Max-Planck-Institut für Radioastronomie,
Auf dem Huügel 69,
53121
Bonn,
Germany
14
Max Planck Institute for Gravitational Physics (Albert Einstein Institute),
30167
Hannover,
Germany
15
Leibniz Universität Hannover,
30167
Hannover,
Germany
16
Jodrell Bank Centre for Astrophysics, Department of Physics and Astronomy, The University of Manchester,
Manchester
M13 9PL,
UK
17
National Astronomical Research Institute of Thailand,
Don Kaeo, Mae Rim,
Chiang Mai
50180,
Thailand
★ Corresponding author: This email address is being protected from spambots. You need JavaScript enabled to view it.
Received:
17
July
2025
Accepted:
16
December
2025
Abstract
Aims. The mysterious Galactic center (GC) gamma-ray (γ-ray) excess (GCE) could be explained by a large population of millisecond pulsars (MSPs) hiding in the Galactic bulge, too faint to be detected as individual high-energy point sources by the Fermi Large Area Telescope and too fast and dispersed to be detected in shallow radio pulsation surveys.
Methods. Motivated by an innovative candidate selection method, we aim to detect millisecond pulsars associated with the GCE by carrying out deep radio pulsation searches toward promising candidates detected in the inner Galaxy in X rays by Chandra and in radio or γ rays by the Very Large Array or Fermi.
Results. We conducted deep radio observation and follow-up campaigns with MeerKAT, as well as the Murriyang and Green Bank telescopes toward nine X-ray candidate sources.
Conclusions. We report the detection of two new MSPs, including a black widow candidate, toward the Galactic bulge: PSRs J1740-2805 and J1740-28. These discoveries double the number of MSPs discovered within the innermost 2° from the GC.
Key words: pulsars: individual: PSR J1740-2805 / pulsars: individual: PSR J1740-2808
An Adjunct Professor at the University of New Mexico.
© The Authors 2026
 Open Access article, published by EDP Sciences, under the terms of the Creative Commons Attribution License (https://creativecommons.org/licenses/by/4.0), which permits unrestricted use, distribution, and reproduction in any medium, provided the original work is properly cited.
This article is published in open access under the Subscribe to Open model. This email address is being protected from spambots. You need JavaScript enabled to view it. to support open access publication.
1 Introduction
The Galactic center (GC) excess (GCE) discovered by the gamma-ray (γ-ray) Large Area Telescope (LAT) aboard the Fermi satellite has been puzzling astrophysicists for more than fifteen years (see Murgia 2020, for a review). Since its discovery, two main explanations have been put forward: dark matter annihilation and unresolved millisecond pulsars (MSPs), which are faint pulsars with rotation periods shorter than 30 ms. Dark matter is indisputably present in the Milky Way and it is plausibly strongly peaked at the GC (Benito et al. 2021; Ou et al. 2024). However, answering the question of whether or not it ends up self-annihilating into γ-ray photons in the Fermi-LAT energy band to produce a spectrum comparable to the GCE spectrum would depend on the nature of dark matter itself and its properties. Hence, identifying the origin of the GCE could have a strong impact on our understanding of dark matter. Alternatively, the GCE could be caused by yet undetected MSPs. Its bulge-like morphology (Bartels et al. 2018a; Macias et al. 2018; Pohl et al. 2022; Song et al. 2024) and its photon-count statistics (Calore et al. 2021; Manconi et al. 2024; List et al. 2021; Mishra-Sharma & Cranmer 2022), among other pieces of evidence, strongly hint at a stellar origin of the GCE (at least in part), thereby favoring the MSP hypothesis. The existence of a large population of MSPs in the Galactic bulge has occasionally been denied in the context of recycled MSP formation (Haggard et al. 2017; Boodram & Heinke 2022), but it can be explained by invoking other formation mechanisms; for instance, accretion-induced collapse of O-Ne white dwarfs in binary systems (Gautam et al. 2022) and disrupted globular clusters (Ye & Fragione 2022). Unlike MSPs in globular clusters and in the Galactic disk, evidence for MSPs in the Galactic bulge is not yet supported by individual radio detections. According to some recent models, the surface density of disk pulsars drastically decreases toward the GC; however, other models predict a residual population within the inner 500 pc (Xie et al. 2024), while others do not (Bartels et al. 2018b). Nonetheless, in all models, the bulge and the disk overlap in the inner Galaxy and associating MSPs with either of these components based on their position alone is therefore challenging. Moreover, even if the position of MSPs on the celestial sphere is often known with very good accuracy, determining their distance (typically computed from their dispersion measure, DM) is more uncertain and strongly dependent on models of the free-electron density of the Galaxy. Existing radio pulsation surveys1 in the GHz band of the inner Galaxy (see Lyon et al. 2016, and references therein) are highly relevant to discover the least dispersed (i.e., closest disk or bulge MSPs), but they are too shallow to unveil distant MSPs, undeniably associated with the bulge and the GCE (Calore et al. 2016). Finding MSPs further in, toward the GC region would not only be useful for understanding stellar evolution and the GCE, but also for probing spacetime around Sagittarius A* (e.g., Liu et al. 2012), as well as the density of free electrons in the inner Galaxy (e.g., Yao et al. 2017). More generally, MSPs are highly relevant for the study of the gravitational wave background from supermassive black holes mergers, (e.g., Agazie et al. 2023; Antoniadis et al. 2023) and the equation of state for cold, dense matter (e.g., Yunes et al. 2022).
The MSP emission spectrum is truly MW, making it possible to search for their emission across frequencies. The launch of the Fermi-LAT enabled a large number of γ-ray pulsar discoveries over the last decade. More than 300 have been reported to date, amounting to more than 140 MSPs (see, e.g., Smith et al. 2023, and references therein). Recently, new radio facilities such as MeerKAT and Five-hundred-meter Aperture Spherical Telescope (FAST) have greatly contributed to increase the detection rate by targeting (among others) unidentified Fermi sources (e.g., Wang et al. 2021; Clark et al. 2023). In our multiwavelength quest for MSPs, we previously demonstrated that −102 GCE MSPs could have been detected in X-ray imaging observations of the GC (Berteaud et al. 2021), assuming that bulge MSPs are the sole cause of the GCE. Then, we identified a large population of MSP candidates within the Chandra Source Catalog (CSC, Evans et al. 2010) with multiwavelength properties in agreement with expectations for bulge MSPs. Among these sources, nine have either a radio or a γ-ray plausible counterpart, making them promising MSP candidates (Berteaud et al. 2024). We conducted deep follow-up radio observations of these nine sources that are potentially associated with the GCE, using MeerKAT, as well as the Murriyang and the Green Bank telescopes. Here, we report on the discovery of two new MSPs toward the Galactic bulge. We describe our observations and results in Sections 2 and 3. Our discussion and conclusions are presented in Sections 4 and 5.
2 Observations and data reduction
2.1 Radio-motivated targets
In Berteaud et al. (2024), we identified five sources that are only detected at X-ray and radio wavelengths, by Chandra and the Karl G. Jansky Very Large Array (VLA) of the National Radio Astronomy Observatory: 2CXO J173946.6-282913, 2CXO J174053.7-275708, 2CXO J174007.6-280708, 2CXO J174011.5-283221, and 2CXO J174017.3-282843. These sources are all within 4° of the GC. We looked for known bright infrared, optical, or ultraviolet counterparts, but we did not find any. Overall, MSPs are usually faint at these wavelengths, and even more so in the Galactic bulge (i.e., when they are especially distant). These five sources are therefore suitable MSP candidates and promising targets for deep radio pulsation searches. We also observed an additional Chandra source having a VLA counterpart: 2CXO J174306.8-293344. This source was rejected as an MSP candidate in Berteaud et al. (2024) because of a positive match with an infrared source located on the rim of the 95 percent error circle of the X-ray source position. We considered this match as a false positive and included this source in our observing program. We provide more information on 2CXO J174306.8-293344 in Appendix A.
2.1.1 Initial observations
We conducted initial observations of these six pulsar candidates with Murriyang, CSIRO’s Parkes Radio Telescope, and the Green Bank Telescope (GBT) of the Green Bank Observatory. We planned our observations accounting for the sources’ flux density at the L band, measured from the VLA image. We observed three of the pulsar candidates with the Murriyang telescope and its Ultra-Wide-bandwidth Low-frequency (UWL, 704-4032 MHz, Hobbs et al. 2020) receiver system during semester 2022APR (Project P1152). The observing time varied from 3 to 8 hours. Pulsar search-mode data were recorded with the MEDUSA backend, a two-bit sampling, a sampling time of 64 μs, and 2048 channels for each of the 26 sub-bands (128 MHz per sub-band). We observed all six pulsar candidates with the GBT at C (2CXO J174306.8-293344, 3.95-7.8 GHz) or S band (5 others, 1.73-2.60 GHz) during semester 2022B (Project 22B-112). Observing time varied from 1 to 5 hours. Pulsar search-mode data were recorded using the VEGAS backend. For the S band, we used a bandwidth of 800 MHz with 2048 channels and 82 μs sampling time. For the C band, we used four VEGAS boards, each with a bandwidth of 1500 MHz, 4096 channels, and 87 μs sampling time. Our initial observations are summarized in Table 1.
2.1.2 Pulsation search
The pulsar search-mode data were searched for periodic dispersed radio pulsations using PRESTO2 (Ransom 2011). Our analysis included the standard RFI excision, Fourier-domain acceleration search (but no jerk search) and optimization for signals with changing apparent spin periods caused by orbital motion (Ransom et al. 2002). We accounted for DMs in the range 0-1000 cm−3 pc. Each Murriyang observation was split into three 1024 MHz-wide bands, LOW (~0.9 GHz to ~1.9 GHz), MID (−2 GHz to −3 GHz), and HIGH (−3 GHz to −4 GHz) and processed separately. GBT C-band data from the four VEGAS boards were combined offline resulting in a combined data set of 4500 MHz bandwidth, split in 12288 channels.
2.1.3 Timing and positions
We detected a pulsar in the direction of 2CXO J174007.6-280708 (see Sect. 3), one of the MSP candidates targeted with the GBT.
We immediately sought and obtained Director’s time at the VLA (Project 23B-312) to investigate the precise position of the newly discovered pulsar in the imaging data. The VLA observation indicated that the pulsar and 2CXO J174007.6-280708 were not likely to be associated, as no continuum radio source was detected at the position of the X-ray target. More details on the VLA data analysis are provided in Appendix B. We also sought and obtained Parkes Director’s time (Project PX117). We used these data to confirm the detection of PSR J1740-28, but also identified and confirmed the detection of a second pulsar in the same beam: PSR J1740-2805. The latter was then detected in the VLA observation mentioned above (see Appendix B for more details) and is also unassociated with our initial X-ray target.
A regular timing campaign of PSRs J1740-28 and J1740-2805 was started during semester 2024APR, regularly observing their position with a single beam of the Murriyang telescope for 4 hours per epoch (Project P1317). Since both pulsars had a similar DM (see Sect. 3), the UWL system was used in the coherently de-dispersed search mode with DM = 317 pc cm−3, the DM of the faintest of both pulsars, and 1 MHz frequency resolution. Each observation was folded using the DSPSR3 (van Straten & Bailes 2011) software package with a sub-integration length of 30 s. Data affected by a narrowband and impulsive RFI were manually excised using the PSRCHIVE4 (Hotan et al. 2004) software package. Each observation was then averaged in time and frequency and the pulse time of arrival (ToA) was measured using PSRCHIVE. The analysis was carried out using the TEMPO25 software package (Hobbs et al. 2006) to obtain a phase-connected timing solution.
Summary of our observations.
2.2 γ-ray motivated targets
A subset of the candidates6 identified in Berteaud et al. (2024) were also crossmatched with Fermi’s Fourth Source Catalog (Abdollahi et al. 2020). Two fall within the 95 percent confidence level error circles of 4FGL-DR2 cataloged sources with no associated counterparts and one falls within the 95 percent confidence level error circle of 4FGL J1735.7-3026, associated with the globular cluster Terzan 1. We note that counterparts of Fermi sources recorded in the Fourth Source Catalog are found using a Bayesian or a likelihood ratio method, solely based on spatial coincidence (Abdo et al. 2010). All three Fermi counterparts, listed in Table 2, show a pulsar-like spectral energy distribution.
Chandra - Fermi plausible associations.
2.2.1 Observations
The observations of the γ-ray motivated targets were carried as part of the Transients and Pulsars with MeerKAT (TRAPUM7) Large Science Project (Stappers & Kramer 2018). The Fermi working group, within TRAPUM, observed two of the candidates on May 20, 2023 for 90 min each using the MeerKAT S-band receiver at central frequency 2843 MHz (S3 sub-band) and with 875 MHz of nominal observing bandwidth. The observations were designed to reach flux a density threshold of about 10 μJy for millisecond periods: 5 ms (12 ms) if 4FGL J1742.5-2833 is at 5.2 kpc (8.5 kpc), and 1 ms for 4FGL J1750.4-3023, regardless of the source possible distance. Pulsar search-mode data were recorded with an eight-bit sampling, a sampling time of 74 μs and 2048 channels. Our observations are summarized in Table 1.
Terzan 1 (and, therefore, 2CXO J173545.5-302859) was observed as part of the TRAPUM globular cluster pulsar survey (e.g., Abbate et al. 2022; Ridolfi et al. 2022; Padmanabh et al. 2024). The cluster was observed on September 21st, 2023 for 2 hours using the MeerKAT S-band receivers, at a central frequency of 2406 MHz (S1 sub-band) and with 875 MHz of nominal observing bandwidth. The data were recorded with two backends in parallel. Pulsar Timing User Supplied Equipment (PTUSE, Bailes et al. 2020) was used to record two tied-array beams, both of which had their boresights located at the nominal center of Terzan 1. The first PTUSE beam was synthesized correlating the signals of all the available antennas (56, on the day of the observation); hence, it allowed for the maximum sensitivity but covered a fairly small sky area, as the beam full width half maximum (FWHM) was approximately 3 arcsec at 2406 MHz. The second PTUSE beam was synthesized using only 38 MeerKAT antennas, all located within an area of 1 km in radius. This allowed for a larger field of view, with a beam FWHM of ~ 23 arcsec, at the cost of a ~30 percent reduction in raw sensitivity. Both PTUSE beams were recorded as search-mode PSRFITS files with full-Stokes information, a time resolution of 18.72 μs and eight-bit digitization. The 875-MHz bandwidth was recorded as 256, 3.418-MHz-wide frequency channels, coherently de-dispersed with DM = 380.68 pc cm−3, namely, the average DM of all known pulsars in Terzan 1 (Singleton et al. 2024).
In parallel with PTUSE, we used the Filterbanking Beamformer User Supplied Equipment (FBFUSE) computing cluster to correlate the signals of all the 56 antennas and to produce 18 tied-array beams. These were tiled around the globular cluster’s center, with a 70% overlap, using an optimal hexagonal tessellation calculated by the Mosaic8 software (Chen et al. 2021). The beams were in turn recorded by the Accelerated Pulsar Search User Supplied Equipment (APSUSE) computing cluster as search-mode “filterbank” files, retaining total-intensity only, with a time resolution of 74.89 μs, and 4096 frequency channels, with no coherent de-dispersion. Shortly after the observation was over, each filterbank file of the 18 beams was incoherently dedispersed with the same DM of 380.68 pc cm−3 and groups of 16 adjacent frequency channels were summed together. Thus, 256-channel filterbank files were produced, so as to significantly reduce the total data volume.
2.2.2 Pulsation search
The search-mode data collected toward each target were searched for periodic dispersed radio pulsations using Pulsar Miner9 (Ridolfi et al. 2021), a Python wrapper for PRESTO (Ransom 2011). Our analysis included the standard radio-frequency interference (RFI) excision, Fourier-domain acceleration search, and optimization for signals with changing apparent spin periods caused by orbital motion. We accounted for DMs in the range 10 to 1200 cm−3 pc.
3 Results
We report on the discovery of two new radio MSPs, PSRs J1740-28 and J1740-2805, in the direction of target 2CXO J174007.6-280708. Their spin periods are shorter than 30 ms, a cut-off value commonly used to disentangle MSPs from non-MSPs (see e.g., Smith et al. 2023), but they are higher than the mean or median of known the MSP population, indicating that they might not be fully recycled. Their integrated pulse profile and frequency-phase waterfall plots are shown in Figure 1 and their preliminary parameters are summarized in Table 3. More observations are required to fully characterize these two new MSPs and understand their formation scenarios. Both sources are further detailed below. Non-detections are also discussed, along with the upper limits on pulsations, are shown in Table 4 and Appendix C.
3.1 Detections
3.1.1 PSR J1740-28
PSR J1740-28 was first detected with 13σ significance during a 3-hour, GBT observation at the S band (1600-2400 MHz). Subsequent observations conducted with the Murriyang telescope consistently detected the pulsar and confirmed its discovery. PSR J1740-28 has a period of 15.4 ms and a DM of 317 cm−3 pc. For this line of sight and DM, the free electron density models YMW16 (Yao et al. 2017) and NE2001 (Cordes & Lazio 2002) predicted a distance of 5.29 and 4.58 kpc, respectively. Due to the faintness of the pulsar, the ToAs collected during this initial timing campaign did not allow us to obtain a phase-connected timing solution. We nonetheless obtained a non-phase-connected timing solution and a rough position estimate by applying a prior on the position of 133 arc seconds, which corresponds to the radius of the GBT beam at the S band. Our analysis also revealed that PSR J1740-28 has a low-mass companion (<0.53 M⊙) and the binary system has a period of about 191 days and a low eccentricity of 0.0004 (see Table 3 for more details).
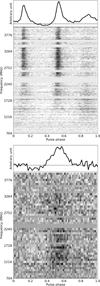 |
Fig. 1 Integrated pulse profile and frequency-phase waterfall of PSRs J1740-2805 (top) and J1740-28 (bottom). Data from all available Murriyang observing epochs were combined to enhance the signal-tonoise ratio. |
Measured and derived parameters of two new MSPs.
Spin period upper limits.
3.1.2 PSR J1740-2805
PSR J1740-2805 was first detected in Murriyang follow-up observations of PSR J1740-28, in the upper part of the covered UWL frequency band, and later redetected in the initial GBT data. It has a period of 7.51 ms and a DM of 330 cm−3 pc. For this line of sight and DM, the YMW16 and NE2001 free electron density models predict a distance of 7.01 and 4.74 kpc, respectively. We note that according to the YMW16 distance, this MSP is very likely to be located in the bulge, although we cannot completely exclude the potential of it residing in the disk. A quantitative estimate of the probability of this MSP to be in the bulge requires a theoretical work that falls beyond the scope of this observational paper. We obtained a timing-derived position of sub-arc-second precision of PSR J1740-2805 and found the pulsar as a continuum, circularly polarized, unresolved radio source identified as a pulsar candidate by Frail et al. (2024) in MeerKAT L-band imaging data, source on line 20 in their Table 3. This source has reported L-band flux density of 0.86 ± 0.02 mJy and a spectral index of −1.46 ± 0.15. This result matches our VLA observations (described in Appendix B). It was independently observed by the Survey of COmpact sources for Pulsars and Exotic objects10 and PSR re-detected two years after our initial discovery. PSR J1740-2805 has a low-mass companion with minimal mass 0.05 M⊙ and the binary system has a compact orbit with a period of 0.48 days. PSR J1740-2805 could therefore be classified as spider pulsar, more precisely a black widow, following the recent definition provided in the SpiderCat11 (Koljonen & Linares 2025). We note that the criteria used for classification of pulsars as spiders vary across different works, such as Eichler & Levinson (1988); Roberts (2013). Unlike PSR J1740-28, PSR J1740-2805 shows a multiple-component pulse profile, as can be seen in Figure 1.
PSR J1740-2805 is located 1.6 arcmin from the initial X-ray target, which indicates that they cannot be associated. No other X-ray source can be associated with the pulsar either, including the LMXB IGR J17407-2808 (Ducci et al. 2023). The sensitivity of Chandra at the position of the pulsar and, therefore, the upper limit on the X-ray flux of a potential X-ray counterpart is 4.62 × 10⁻¹⁵ erg cm−2 s−1 in the broadband (0.5-7 keV). No Gaia or VVV sources are found within 2 arcsec of the pulsar position.
3.2 Non-detections
No pulsars were discovered toward our eight other targeted candidates. To understand whether our observations would rule out such assumptions of their nature, we provide estimated upper limits on their spin period by calculating the theoretical maximal period detectable given their radio flux density. For radio-motivated targets, we estimated their flux density at our observing frequency from the VLA L-band imaging data in which they had initially been detected. We do not provide upper limits for our γ-ray motivated targets due to the lack of identified radio counterparts. We emphasize (as noted below) that these limits depend on a number of assumptions and models and are only given on an indicative basis. For example, we cannot rule out the possibility that these sources, especially those only observed once, are pulsars in highly accelerated and/or eclipsing binary systems. Spider pulsars, and in particular redbacks, are well-known X-ray sources and their binary motion can cause eclipses.
3.2.1 Methodology
We assumed that the Chandra/VLA sources we observed have a power-law spectrum at radio wavelengths with a steep spectral index α as is usually the case for MSPs. We extrapolated their flux densities from L-band data (provided in Table A.1 and in Berteaud et al. (2024), Table 1) to our GBT observing frequencies. Then, we computed the periods, P, according to the radiometer equation (Dewey et al. 1984):
 (1)
(1)
where σ is the desired S/N, Ttot = 20 K + Tsky is the sum of the system and the sky temperatures, G = 2 K/Jy is the telescope gain, np=2 is the number of polarizations, Tobs the observing time in s, ∆ν the bandwidth in MHz, and wobs is the observed width of the pulse in ms. We extrapolated the sky temperature at the source positions from the 408 MHz map of Haslam et al. (1982), assuming a power-law rescaling to the frequency of interest with index −2.6 (Lawson et al. 1987). The observed width of the pulse, wobs, is computed as
 (2)
(2)
where w = 0.2 P, assuming a 20 percent pulse duty cycle, while τscat is the scattering time that depends on the DM at the MSP position, following, for instance, Bhat et al. (2004):
 (3)
(3)
Here, τDM = 8.3 × 10⁶DM∆ν/(nchanν3) is the DM smearing time, where nchan is the number of channels over the bandwidth. Finally, τsamp is the sampling timescale.
The values Pmax of P that verify Eq. (1) can be interpreted as upper limits on the periodicity of undetected pulsars. We emphasize that these limits are theoretical and do not account for certain properties (e.g., scintillation, eclipses, RFI and limited computing power). We assumed a specific intrinsic pulse width, electron density model, distance to the source, and spectral index. We also assumed that all the radio emission comes from the pulsed emission. We note that Eq. (3) is an estimation of the scattering timescale and is subject to large uncertainties.
3.2.2 Upper limits
Using the methodology presented in Sect. 3.2.1, we ruled out a pulsar nature for 2CXO J173946.6-282913 and J174007.6-280708, as our observations would have revealed any period larger than 0.9 ms, which is shorter than the period of the fastest known pulsar (Hessels et al. 2006). We ruled out the possibility that 2CXO J174053.7-275708, 2CXO J174011.5-283221, and 2CXO J174017.3-282843 are young pulsars, but not MSPs, as they could still have periods less than 1.52, 1.63, and 2.86 ms, respectively. Our limits on these targets are summarized in Table 4. Additionally, we can rule out the young pulsar nature of 2CXO J174306.8-293344 under certain conditions, depending on the assumptions made on its radio spectral index (not too steep) and/or its distance (closer than 8.5 kpc). More information on the spectral index and position dependency of all our upper limits is provided in the Appendix C.
The observations we conducted with MeerKAT should have detected any pulsation down to flux densities ~10 μJy. We therefore excluded the pulsar nature of 2CXO J175039.6-302056 and 2CXO J174235.4-282829, although we cannot guarantee the absence of scintillation and eclipses that could bias our observations or the possibility that they are very faint pulsars. As the data collected toward Terzan 1 were recorded in coherent de-dispersion mode, the sensitivity of the observation to pulsars with DM values much higher or lower than the globular cluster’s DM could be reduced. Hence, we conclude that the 2CXO J173545.5-302859 could either be a background or foreground pulsar; alternatively, it could be a non-pulsar source within Terzan 1. We additionally compared the position of 2CXO J173545.5-302859 with the timing-derived positions of the known pulsars in Terzan 1 (Singleton et al. 2024), but none of the seven pulsars with timing solutions were found to be within 20” of the Chandra source.
4 Discussion
4.1 X-ray selection of MSP candidates
PSRs J1740-2805 and J1740-28 were discovered in radio observations targeting 2CXO J174007.6-280708, an X-ray source identified as a bulge MSP candidate in a previous work (Berteaud et al. 2024). Our observations are the first observational searches for MSP associated with possible X-ray counterparts of the GCE and such observations are highly relevant to evaluate the impact of this novel candidate-identification method. The VLA Director’s time observation and/or the timing-derived position ruled out the association of 2CXO J174007.6-280708 with the newly discovered pulsars, making their discovery serendipitous. We emphasize that in Berteaud et al. (2024), we identified more than 1400 X-ray sources as MSP candidates, while only ~100 MSPs were expected to be above the X-ray sensitivity of existing Chandra observations (Berteaud et al. 2021). Therefore, we expect 7 percent or less of the candidates to be actual MSPs. The fraction of sources that were observed in this work represents less than one percent of all our candidates and cannot yet rule out our selection strategy. Deeper radio images of the inner Galaxy will be key in formally excluding the pulsar nature of these candidates and further refining the selection criteria by understanding discriminating X-ray features.
4.2 Need for deep pulsation searches
Existing radio surveys have been shown to be too shallow to unveil a population of Galactic bulge MSPs responsible for the GCE (Calore et al. 2016). Indeed, radio light coming from the GC is highly dispersed, but most importantly, it is so scattered that the pulsed emission of fast pulsars is easily smoothed out in short observations. We can get around dispersive smearing, to a point, by using coherent de-dispersion, but to mitigate scattering, it is necessary to access observations at much higher radio frequencies, which, in turn, requires higher sensitivity.
The non-association of 2CXO J174007.6-280708 with either PSRs J1740-2805 or PSR J1740-28 makes the discovery of these two new pulsars serendipitous. However, it demonstrates the power of (and, thus, the need for) deep targeted radio observations. Recently, PSR J1744-2946, another MSP, has also been serendipitously discovered in deep observations targeting an X-ray source at the GC (Lower et al. 2024). We also note that radio imaging with a focus on compact, polarized and/or steepspectrum12 sources (Bhakta et al. 2017; Lower et al. 2024; Frail et al. 2024) has proven to be a productive and complementary approach for identifying promising bulge MSP candidates.
4.3 A possible new globular cluster
The detection of two MSPs in a single radio beam, with comparable DMs, naturally raises the question of the discovery of a new globular cluster. We argue that PSRs J1740-2805 and J1740-28 are instead part of the Galactic field. Hints that PSR J1740-2805 and PSR J1740-28 belong to a globular cluster would be represented by, for instance, an even smaller difference in their DMs (see Freire et al. 2005, Figure 4), or negative period derivatives. Indeed, 93 percent of MSPs in the ATNF pulsar catalog (Manchester et al. 2005) that have a negative period derivative (not corrected for the Shklovskii effect) are located in globular clusters and 45 percent of MSPs in globular clusters have negative period derivative.
5 Conclusion
In this paper, we report the detection of two new MSPs toward the GC. PSRs J1740-2805 and J1740-28 have rotation periods of 7.5 and 15.4 ms, respectively, and DMs above 300 cm−3 pc. Both reside in binary systems with low-mass companions and PSR J1740-2805 additionally meets the criteria for black widows, a sub-type of spider pulsars. We did not find any evidence of known multiwavelength counterparts, but we did identify a cataloged radio continuum source at its position (Frail et al. 2024). Both pulsars were discovered in deep radio observations targeting, for the first time, an X-ray source identified as bulge MSP candidate (Berteaud et al. 2024). Despite the lack of MSP discoveries associated with our initial targets, our novel selection method cannot be ruled out as yet and, thus, it remains to be further explored. The detection of PSRs J1740-2805 and J1740-28 double the number of MSPs discovered within the innermost 2° from the GC, and given their distance estimates (see Sect. 3), they are both compatible with being part of the bulge population (Berteaud et al. 2021). However, at these distances (around 5-6 kpc from Earth), the Galactic MSP population from the disk and the expected bulge overlap significantly. Disentangling the two with the low number of MSPs detected in the direction of the GC is challenging, but the increasing number of discoveries may finally make it possible (Berteaud et al., in prep.).
Acknowledgements
This work is supported by NASA under award number 80GSFC21M0002. J.B., F.C. and M.C. acknowledge financial support from the Programme National des Hautes Energies of CNRS/INSU with INP and IN2P3, co-funded by CEA and CNES, from the ‘Agence Nationale de la Recherche’, grant number ANR-19-CE310005-01 (PI: F. Calore), and from the Centre National d’Etudes Spatiales (CNES). FC warmly thanks P. D. Serpico for enlightening discussion. SR is a CIFAR Fellow and is supported by the NSF Physics Frontiers Center award 2020265. Murriyang, CSIRO’s Parkes radio telescope, is part of the Australia Telescope National Facility (https://ror.org/05qajvd42) which is funded by the Australian Government for operation as a National Facility managed by CSIRO. We acknowledge the Wiradjuri people as the Traditional Owners of the Observatory site. This material is based upon work supported by the National Radio Astronomy Observatory and Green Bank Observatory which are major facilities funded by the U.S. National Science Foundation operated by Associated Universities, Inc. The MeerKAT telescope is operated by the South African Radio Astronomy Observatory (SARAO), which is a facility of the National Research Foundation, an agency of the Department of Science and Innovation. We thank staff at SARAO for their help with observations and commissioning. TRAPUM observations used the FBFUSE and APSUSE computing clusters for data acquisition, storage and analysis. These clusters were funded and installed by the Max-Planck-Institut für Radioastronomie (MPIfR) and the Max-Planck-Gesellschaft. This research has made use of data obtained from the Chandra Source Catalog provided by the Chandra X-ray Center (CXC). F.A. acknowledges that part of the research activities de- scribed in this paper were carried out with the contribution of the NextGenerationEU funds within the National Recovery and Resilience Plan (PNRR), Mission 4 - Education and Research, Component 2 - From Research to Business (M4C2), Investment Line 3.1 - Strengthening and creation of Research Infrastructures, Project IR0000034 - ‘STILES - Strengthening the Italian Leadership in ELT and SKA’.
References
- Abbate, F., Ridolfi, A., Barr, E. D., et al. 2022, MNRAS, 513, 2292 [NASA ADS] [CrossRef] [Google Scholar]
- Abdo, A. A., Ackermann, M., Ajello, M., et al. 2010, ApJS, 188, 405 [NASA ADS] [CrossRef] [Google Scholar]
- Abdollahi, S., Acero, F., Ackermann, M., et al. 2020, ApJS, 247, 33 [Google Scholar]
- Agazie, G., Anumarlapudi, A., Archibald, A. M., et al. 2023, ApJ, 951, L8 [NASA ADS] [CrossRef] [Google Scholar]
- Antoniadis, J., Arumugam, P., Arumugam, S., et al. 2023, A&A, 678, A50 [CrossRef] [EDP Sciences] [Google Scholar]
- Bailes, M., Jameson, A., Abbate, F., et al. 2020, PASA, 37, e028 [NASA ADS] [CrossRef] [Google Scholar]
- Bartels, R., Storm, E., Weniger, C., & Calore, F. 2018a, Nat. Astron., 2, 819 [NASA ADS] [CrossRef] [Google Scholar]
- Bartels, R. T., Edwards, T. D. P., & Weniger, C. 2018b, MNRAS, 481, 3966 [Google Scholar]
- Benito, M., Iocco, F., & Cuoco, A. 2021, Phys. Dark Universe, 32, 100826 [Google Scholar]
- Berteaud, J., Calore, F., Clavel, M., et al. 2021, Phys. Rev. D, 104, 043007 [CrossRef] [Google Scholar]
- Berteaud, J., Calore, F., Clavel, M., et al. 2024, A&A, 690, A330 [NASA ADS] [CrossRef] [EDP Sciences] [Google Scholar]
- Bhakta, D., Deneva, J. S., Frail, D. A., et al. 2017, MNRAS, 468, 2526 [Google Scholar]
- Bhat, N. D. R., Cordes, J. M., Camilo, F., Nice, D. J., & Lorimer, D. R. 2004, ApJ, 605, 759 [CrossRef] [Google Scholar]
- Boodram, O., & Heinke, C. O. 2022, MNRAS, 512, 4239 [Google Scholar]
- Calore, F., Di Mauro, M., Donato, F., Hessels, J. W. T., & Weniger, C. 2016, ApJ, 827, 143 [NASA ADS] [CrossRef] [Google Scholar]
- Calore, F., Donato, F., & Manconi, S. 2021, Phys. Rev. Lett., 127, 161102 [CrossRef] [PubMed] [Google Scholar]
- Chen, W., Barr, E., Karuppusamy, R., Kramer, M., & Stappers, B. 2021, J. Astron. Instrum., 10, 2150013 [NASA ADS] [CrossRef] [Google Scholar]
- Clark, C. J., Breton, R. P., Barr, E. D., et al. 2023, MNRAS, 519, 5590 [NASA ADS] [CrossRef] [Google Scholar]
- Cordes, J. M., & Lazio, T. J. W. 2002, arXiv e-prints [arXiv:0207156] [Google Scholar]
- Dewey, R., Stokes, G., Segelstein, D., Taylor, J., & Weisberg, J. 1984, in Birth and Evolution of Neutron Stars: Issues Raised by Millisecond Pulsars, eds. S. P. Reynolds, & D. R. Stinebring, 234 [Google Scholar]
- Ducci, L., Malacaria, C., Romano, P., et al. 2023, A&A, 674, A100 [NASA ADS] [CrossRef] [EDP Sciences] [Google Scholar]
- Eichler, D., & Levinson, A. 1988, ApJ, 335, L67 [NASA ADS] [CrossRef] [Google Scholar]
- Evans, I. N., Primini, F. A., Glotfelty, K. J., et al. 2010, ApJS, 189, 37 [NASA ADS] [CrossRef] [Google Scholar]
- Frail, D. A., Polisensky, E., Hyman, S. D., et al. 2024, ApJ, 975, 34 [Google Scholar]
- Freire, P. C. C., Hessels, J. W. T., Nice, D. J., et al. 2005, ApJ, 621, 959 [NASA ADS] [CrossRef] [Google Scholar]
- Gautam, A., Crocker, R. M., Ferrario, L., et al. 2022, Nat. Astron., 6, 703 [CrossRef] [Google Scholar]
- Haggard, D., Heinke, C., Hooper, D., & Linden, T. 2017, J. Cosmology Astropart. Phys., 2017, 056 [Google Scholar]
- Haslam, C. G. T., Salter, C. J., Stoffel, H., & Wilson, W. E. 1982, A&AS, 47, 1 [Google Scholar]
- Hessels, J. W. T., Ransom, S. M., Stairs, I. H., et al. 2006, Science, 311, 1901 [CrossRef] [PubMed] [Google Scholar]
- Hobbs, G. B., Edwards, R. T., & Manchester, R. N. 2006, MNRAS, 369, 655 [Google Scholar]
- Hobbs, G., Manchester, R. N., Dunning, A., et al. 2020, PASA, 37, e012 [NASA ADS] [CrossRef] [Google Scholar]
- Hotan, A. W., van Straten, W., & Manchester, R. N. 2004, PASA, 21, 302 [Google Scholar]
- Koljonen, K. I. I., & Linares, M. 2025, ApJ, 994, 8 [Google Scholar]
- Lange, C., Camilo, F., Wex, N., et al. 2001, MNRAS, 326, 274 [NASA ADS] [CrossRef] [Google Scholar]
- Lawson, K. D., Mayer, C. J., Osborne, J. L., & Parkinson, M. L. 1987, MNRAS, 225, 307 [Google Scholar]
- List, F., Rodd, N. L., & Lewis, G. F. 2021, Phys. Rev. D, 104, 123022 [CrossRef] [Google Scholar]
- Liu, K., Wex, N., Kramer, M., Cordes, J. M., & Lazio, T. J. W. 2012, ApJ, 747, 1 [Google Scholar]
- Lower, M. E., Dai, S., Johnston, S., & Barr, E. D. 2024, ApJ, 967, L16 [Google Scholar]
- Lucas, P. W., Hoare, M. G., Longmore, A., et al. 2008, MNRAS, 391, 136 [Google Scholar]
- Lyon, R. J., Stappers, B. W., Cooper, S., Brooke, J. M., & Knowles, J. D. 2016, MNRAS, 459, 1104 [NASA ADS] [CrossRef] [Google Scholar]
- Macias, O., Gordon, C., Crocker, R. M., et al. 2018, Nat. Astron., 2, 387 [CrossRef] [Google Scholar]
- Manchester, R. N., Hobbs, G. B., Teoh, A., & Hobbs, M. 2005, AJ, 129, 1993 [Google Scholar]
- Manconi, S., Calore, F., & Donato, F. 2024, Phys. Rev. D, 109, 123042 [Google Scholar]
- Mishra-Sharma, S., & Cranmer, K. 2022, Phys. Rev. D, 105, 063017 [NASA ADS] [CrossRef] [Google Scholar]
- Murgia, S. 2020, Annu. Rev. Nucl. Part. Sci., 70, 455 [NASA ADS] [CrossRef] [Google Scholar]
- Ou, X., Eilers, A.-C., Necib, L., & Frebel, A. 2024, MNRAS, 528, 693 [NASA ADS] [CrossRef] [Google Scholar]
- Padmanabh, P. V., Ransom, S. M., Freire, P. C. C., et al. 2024, A&A, 686, A166 [NASA ADS] [CrossRef] [EDP Sciences] [Google Scholar]
- Pohl, M., Macias, O., Coleman, P., & Gordon, C. 2022, ApJ, 929, 136 [CrossRef] [Google Scholar]
- Ransom, S. 2011, PRESTO: PulsaR Exploration and Search TOolkit, Astrophysics Source Code Library [record ascl:1107.017] [Google Scholar]
- Ransom, S. M., Eikenberry, S. S., & Middleditch, J. 2002, AJ, 124, 1788 [Google Scholar]
- Ridolfi, A., Gautam, T., Freire, P. C. C., et al. 2021, MNRAS, 504, 1407 [NASA ADS] [CrossRef] [Google Scholar]
- Ridolfi, A., Freire, P. C. C., Gautam, T., et al. 2022, A&A, 664, A27 [NASA ADS] [CrossRef] [EDP Sciences] [Google Scholar]
- Roberts, M. S. E. 2013, in IAU Symposium, 291, Neutron Stars and Pulsars: Challenges and Opportunities after 80 years, ed. J. van Leeuwen, 127 [Google Scholar]
- Singleton, J., DeCesar, M., Dai, S., et al. 2024, ApJ, submitted [arXiv:2412.11271] [Google Scholar]
- Smith, D. A., Abdollahi, S., Ajello, M., et al. 2023, ApJ, 958, 191 [NASA ADS] [CrossRef] [Google Scholar]
- Song, D., Eckner, C., Gordon, C., et al. 2024, MNRAS, 530, 4395 [Google Scholar]
- Stappers, B., & Kramer, M. 2018, PoS, MeerKAT2016, 009 [Google Scholar]
- van Straten, W., & Bailes, M. 2011, PASA, 28, 1 [Google Scholar]
- Wang, P., Li, D., Clark, C. J., et al. 2021, Sci. China Phys. Mech. Astron., 64, 129562 [NASA ADS] [CrossRef] [Google Scholar]
- Xie, J. T., Wang, J. B., Wang, N., Manchester, R., & Hobbs, G. 2024, ApJ, 963, L39 [Google Scholar]
- Yao, J. M., Manchester, R. N., & Wang, N. 2017, ApJ, 835, 29 [NASA ADS] [CrossRef] [Google Scholar]
- Ye, C. S., & Fragione, G. 2022, ApJ, 940, 162 [Google Scholar]
- Yunes, N., Miller, M. C., & Yagi, K. 2022, Nat. Rev. Phys., 4, 237 [NASA ADS] [CrossRef] [Google Scholar]
See https://www.jb.man.ac.uk/pulsar/surveys.html for a list of major pulsar surveys conducted since 1967.
Respecting the aggressive X-ray spectral constraints of Berteaud et al. (2021).
Appendix A 2CXO J174306.8-293344
In Berteaud et al. (2024), we identified five promising MSP candidates detected at radio and X-ray wavelengths. In our proposed follow-up observation of these sources, we also included 2CXO J174306.8-293344, an additional MSP candidate detected at radio and X-ray wavelength with a possible infrared counterpart on the rim of the position error circle, that we interpreted as a false-positive match. The angular separation between the radio and the X-ray source is less than 0.6 arcsec and the radio source is compact in size. More information about the MSP candidate is provided in Table A.1.
Complementary table to Table 1 of Berteaud et al. (2024).
Appendix B VLA observations
Successful observations were performed with the Karl G. Jansky Very Large Array (VLA) in D-array configuration (minimum baseline length of 35 m, maximum baseline length of 1.03 km) on November 24 and 25, 2023 under project code VLA/23B-312. These observations were conducted at the L (1-2 GHz) and S bands (2-4 GHz), phasing the array for pulsar recording using the YUPPI backend in addition to the regular WIDAR correlation. The phasing calibrator was J1751-2524 and the target field pointing direction was R.A. 17h40m7.624s Dec. −28° 7’ 8.750". The integration time for the target pointing was about 2 and 2.8 hours for the L and S bands, respectively. No continuum radio source was detected at the position of our X-ray target 2CXO J174007.6-280708, indicating that no radio pulsar could be associated with it. MSP J1740-2805, for which we obtained a timing-derived position, was found within the field of view, but 3’ away from the pointing center. No pulsation was detected in the VLA data. The WIDAR correlator continuum data was manually calibrated using CASA 6.6.4-34, performing standard flagging, bandpass and complex gain calibration, as well as flux scaling based on 3C 286. Images were obtained using the adaptive-scale pixel and multi-term multiscale de-convolver for L, S, and L&S bands combined using natural weighting to maximize point source sensitivity. In Fig. B.1 the highest resolution S-band image is presented using natural weighting of visibilities and using only a single n-term, including labeling of locations of MSP J1740-2805. The corresponding S-band (3.0GHz) peak flux at the location of J1740-2805 is 0.68±0.11 mJy/beam. Combination of both L and S-band data and using two n-terms (linear spectral fit) results in a 2.5 GHz peak flux of 1.18±0.60 mJy/beam. The location of J1740-2805 sits on-top of an extended radio source toward the Northern edge with an in-band spectral index combining L and S-band data of −1.45±0.30.
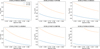 |
Fig. B.1 Naturally weighted S-band radio image obtained by the VLA. The image has an rms of 100 μJy/beam. The cross marks the position of MSP J1740-2805. The white ellipse in the lower left corner shows the synthesized beam shape, representing the image resolution. The color bar on the right relates the color scale to the intensity in Jy/beam. |
Appendix C Details on non-detections
The detection or non-detection of a pulsar depends, for a given observation setting, on its period, flux and DM. The radio/X-ray MSP candidates observed in this work were detected in L-band imaging data but pulsations were searched at higher frequencies (S and C band) to limit pulse broadening. Therefore, we extrapolated fluxes assuming a power-law spectrum with a steep spectral index. We estimated the DMs from the YMW16 electron density model assuming a distance of 5.2 kpc and 8.5 kpc, which are the expected minimal and mean distance of X-ray detectable bulge MSPs (Berteaud et al. 2021). In Figure C.1, we show the upper limit Pmax on the rotation period of potential pulsations as a function of the radio spectral index and the distance to the source for our six candidate sources, as observed with GBT.
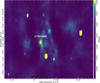 |
Fig. C.1 Maximum rotation period, Pmax, for two different distances as a function of radio spectral index for our 6 MSP candidates detected by Chandra and the VLA, and observed in this work by Murriyang and/or the GBT. |
All Tables
All Figures
|
Fig. 1 Integrated pulse profile and frequency-phase waterfall of PSRs J1740-2805 (top) and J1740-28 (bottom). Data from all available Murriyang observing epochs were combined to enhance the signal-tonoise ratio. |
| In the text | |
|
Fig. B.1 Naturally weighted S-band radio image obtained by the VLA. The image has an rms of 100 μJy/beam. The cross marks the position of MSP J1740-2805. The white ellipse in the lower left corner shows the synthesized beam shape, representing the image resolution. The color bar on the right relates the color scale to the intensity in Jy/beam. |
| In the text | |
|
Fig. C.1 Maximum rotation period, Pmax, for two different distances as a function of radio spectral index for our 6 MSP candidates detected by Chandra and the VLA, and observed in this work by Murriyang and/or the GBT. |
| In the text | |
Current usage metrics show cumulative count of Article Views (full-text article views including HTML views, PDF and ePub downloads, according to the available data) and Abstracts Views on Vision4Press platform.
Data correspond to usage on the plateform after 2015. The current usage metrics is available 48-96 hours after online publication and is updated daily on week days.
Initial download of the metrics may take a while.