Fig. 1.
Download original image
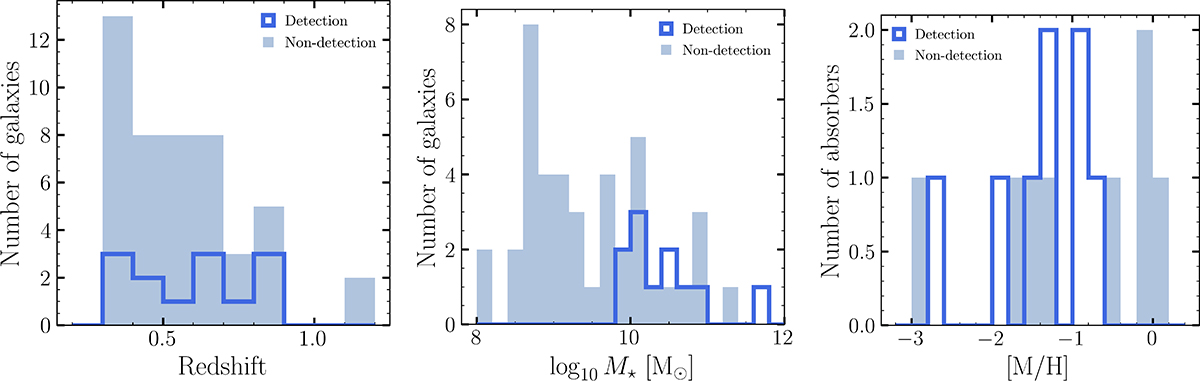
Distribution of CO detections (blue) and non-CO detections (light blue) on galaxies as a function of redshift (left) and stellar mass (middle). The right panel is plotted as a function of metallicity corresponding to multiple galaxies associated with the absorbers (Halley et al., in prep). This figure represents the MUSE-ALMA Haloes survey, including all the sources from the new ALMA Large Program and previous ALMA data (see Section 2.2). The middle and right panels have fewer numbers because only those with reliable M★ and [M/H] determinations are included. The median values for the detections are 0.6, 9.66 and −1.23 for the redshift, stellar mass and absorption metallicity, while the non-detections have median values of 0.5, 9.16, and −1.84. Overall, we report no clear correlation between the detection rate and any of these properties, which suggests that the detection of CO emission may be governed by a combination of global galaxy properties, rather than just one property alone.
Current usage metrics show cumulative count of Article Views (full-text article views including HTML views, PDF and ePub downloads, according to the available data) and Abstracts Views on Vision4Press platform.
Data correspond to usage on the plateform after 2015. The current usage metrics is available 48-96 hours after online publication and is updated daily on week days.
Initial download of the metrics may take a while.