| Issue |
A&A
Volume 707, March 2026
|
|
|---|---|---|
| Article Number | A81 | |
| Number of page(s) | 16 | |
| Section | Extragalactic astronomy | |
| DOI | https://doi.org/10.1051/0004-6361/202556531 | |
| Published online | 02 March 2026 | |
MUSE-ALMA Haloes
XII. Molecular gas in z ∼ 0.5 H I – selected galaxies
1
European Southern Observatory Karl-Schwarzschild-Str. 2 85748 Garching near Munich, Germany
2
Aix Marseille Univ., CNRS, LAM, (Laboratoire d’Astrophysique de Marseille), UMR 7326 F-13388 Marseille, France
3
Max-Planck-Institut für Extraterrestrische Physik (MPE) Giessenbachstrasse 1 85748 Garching near Munich, Germany
4
Department of Physics and Astronomy, University of South Carolina Columbia SC 29208, USA
5
Max-Planck-Institut für Astrophysik Karl-Schwarzschild-Strasse 1 85748 Garching near Munich, Germany
6
Centre for Astrophysics and Supercomputing, Swinburne University of Technology Hawthorn Victoria 3122, Australia
7
CSIRO Space & Astronomy PO Box 1130 Bentley Western Australia 6102, Australia
8
Observatoire Astronomique de Strasbourg, Université de Strasbourg/CNRS 11 rue de l’Université 67000 Strasbourg, France
9
Leibniz Institut fur Astrophysik Potsdam An der Sternwarte 16 14482 Potsdam, Germany
★ Corresponding author: This email address is being protected from spambots. You need JavaScript enabled to view it.
Received:
21
July
2025
Accepted:
8
January
2026
Abstract
We present further results from the MUSE-ALMA Haloes survey, which includes 79 galaxies associated with strong H I absorption at z ∼ 0.5. As part of this effort, our ALMA Cycle 10 Large Program contributed new observations of 39 systems. This expands on the initial set of 21 systems in the MUSE-ALMA Haloes survey, bringing the total to 60 galaxies. Among the newly observed systems, we detect CO line emission in nine galaxies, corresponding to a 23% detection rate in a sample not selected by metallicity. When combined with prior MUSE-ALMA Haloes data, our total CO detection count rises to 12 out of 60 galaxies (20%), which effectively doubles the number of detected CO-emitting H I–selected galaxies at z ∼ 0.5 and probes a factor of ∼1.2 dex deeper in MH2 than earlier absorber studies. These sources, which were selected based on known circumgalactic H I gas, span a wide range of stellar masses and metallicities, providing a unique view of gas-rich environments. By comparing the molecular gas properties, traced through CO(2−1) and CO(3−2) transitions with existing information of their physical properties, such as star formation rates (SFRs) and gas-phase metallicities from VLT/MUSE and HST spectroscopy, we investigate how these systems relate to the population of normal star-forming galaxies at similar redshift. Our deep, unbiased CO observations of H I-selected galaxies reveal a dual behaviour in star formation efficiency. Low-MH2 systems form stars efficiently and follow the scaling relations of main-sequence galaxies, while high-MH2 systems exhibit suppressed star formation and lower-than-expected stellar masses, likely reflecting ongoing gas accretion or environmental regulation. This diversity indicates that H I absorbers trace both evolved, actively star-forming galaxies and younger or dynamically influenced systems that are still building their gas reservoirs. By reaching molecular gas masses more than 1 dex below previous studies, our survey provides a key step towards completing the baryon census at z ∼ 0.5 and characterising the molecular phase of the broader H I-selected population.
Key words: galaxies: evolution / intergalactic medium / quasars: absorption lines / galaxies: star formation
© The Authors 2026
 Open Access article, published by EDP Sciences, under the terms of the Creative Commons Attribution License (https://creativecommons.org/licenses/by/4.0), which permits unrestricted use, distribution, and reproduction in any medium, provided the original work is properly cited.
This article is published in open access under the Subscribe to Open model. This email address is being protected from spambots. You need JavaScript enabled to view it. to support open access publication.
1. Introduction
The evolution of galaxies is fundamentally regulated by the availability and cycling of gas, which serves as the raw material for star formation. Cold gas plays a crucial role in this process, as it forms stars that enrich the interstellar medium (ISM) with metals and dust over time (Kennicutt & Evans 2012; Carilli & Walter 2013; Tacconi et al. 2020). Feedback from supernovae (SNe) and active galactic nuclei (AGNs) injects mechanical and radiative energy into the surrounding environment, which influences the efficiency of star formation and drives large–scale outflows (Oppenheimer & Davé 2008; Lilly et al. 2013; Faucher-Giguère & Oh 2023). These processes collectively shape the baryon cycle, which describes how gas is accreted, converted into stars, and ejected into the circumgalactic medium (CGM), with the potential for subsequent re-accretion (Tumlinson et al. 2017; Péroux & Howk 2020; Peroux & Nelson 2024).
A complete understanding of the baryon cycle requires study of the CGM, which acts as a reservoir of gas that regulates galaxy growth (Werk et al. 2014; Nelson et al. 2020; Naab & Ostriker 2017; Oppenheimer et al. 2021). The CGM has been extensively probed using a multi-wavelength approach. Observations have revealed that the CGM is multi-phase and comprises gas at a range of temperatures, densities, and ionisation states. This includes cold neutral gas, warm ionised gas, and hot, X-ray-emitting plasma. Optical and ultraviolet absorption-line spectroscopy, particularly with the Cosmic Origins Spectrograph on the Hubble Space Telescope (HST) (e.g., Muzahid et al. 2015; Richter et al. 2017) has been crucial in studying ionised gas phases. X-ray observations with Chandra, XMM-Newton, and eROSITA trace the hot component of the CGM (e.g., Strickland et al. 2004; Li 2013; Bogdán et al. 2013; Merloni et al. 2012; Zhang et al. 2025; Lin et al. 2025). Atomic hydrogen (H I) has been investigated both in emission and absorption across cosmic time. Emission observations using the 21 cm line have been key to studying the star formation efficiency, gas kinematics, and disc structure of nearby galaxies (e.g. Haynes & Giovanelli 1984; Zwaan et al. 2005; Bigiel et al. 2008; Leroy et al. 2008; Walter et al. 2008; Catinella et al. 2018; Yu et al. 2022; Sharma et al. 2023; Wang et al. 2023, 2025). However, direct detection of 21 cm emission becomes increasingly difficult beyond z ∼ 0.1, and even harder for individual galaxies at z > 0.4 (Fernández et al. 2016; Xi et al. 2024). To probe higher redshifts, statistical techniques such as spectral stacking and intensity mapping have been adopted (Masui et al. 2013; Rhee et al. 2018; Bera et al. 2019; Chowdhury et al. 2020), and efforts are ongoing, supported by Square Kilometre Array (SKA) precursors and pathfinders (e.g., Blyth et al. 2016; Adams & van Leeuwen 2019; Koribalski et al. 2024; Maddox et al. 2021). Given the emission limitations, 21 cm absorption studies provide a powerful alternative, as sensitivity is independent of the galaxy’s luminosity distance. The Five hundred meter Aperture Spherical Telescope (FAST) has recently enabled discoveries of new low-redshift absorbers (Su et al. 2023; Yu et al. 2024), while the Australian Square Kilometre Array Pathfinder (ASKAP) and MeerKAT have begun probing intermediate redshifts through surveys such as The First Large Absorption Survey in H I (FLASH) and the MeerKAT Absorption Line Survey (MALS) (e.g., Allison et al. 2020; Hotan et al. 2021; Glowacki et al. 2022; Deka et al. 2023; Yoon et al. 2024).
The H I absorption selection method, in particular, has proved to be a powerful tool for detecting neutral gas in the CGM (Wolfire et al. 1995; Wolfe et al. 2005). By observing the Lyα absorption lines against bright background sources, this method enables the identification of diffuse, cold gas that may be difficult to detect in emission. It is highly sensitive to low column densities, independent of redshift, luminosity, or star formation, and provides detailed kinematic information about the gas distribution (e.g., Péroux et al. 2006; Zwaan et al. 2005; Bouché et al. 2010, 2016; Frank et al. 2012; Kacprzak et al. 2011; Stern et al. 2016).
The use of 3D integral field spectroscopy (IFS) has revolutionised our ability to study the connection between galaxies and the CGM, especially in systems selected via H I absorption, such as damped Lyman-α (DLA, log N(H I)/cm2 ≳ 20.3), sub-damped Lyman-α systems (sub-DLAs; 19.0 ≲ log N(H I)/cm2 < 20.3), and Lyman limit systems (LLSs; 18.0 ≲ log N(H I)/cm2 < 19, Péroux et al. 2003). These absorption-selected systems probe some of the most gas-rich environments in the Universe and have long been used to study gas metallicities (e.g., Rafelski et al. 2012; Kulkarni et al. 2005, 2015), kinematics (e.g., Prochaska & Wolfe 1998), gas temperatures (e.g., Kanekar et al. 2014), and chemical enrichment histories (e.g., Dessauges-Zavadsky et al. 2007; Quiret et al. 2016).
Multiple optical surveys have used the integral field spectrograph (IFS) in the Multi-Unit Spectroscopic Explorer (MUSE) installed at the Very Large Telescope (VLT) (Bacon et al. 2010), such as MUSE-QuBES (e.g., Muzahid et al. 2020; Dutta et al. 2024, 2025), and MEGAFLOW (e.g., Bouché et al. 2016; Schroetter et al. 2016; Langan et al. 2023) which established statistical links between CGM absorbers and their associated galaxies. Klimenko et al. (2023) report results from an HST-COS survey with the opposite approach of determining the CGM properties of galaxies observed with IFS at z < 0.1 in the Mapping Nearby Galaxies at Apache Point Observatory (MaNGA survey). Parallel programs including MUSE analysis of gas around galaxies (e.g., MAGG, Dutta et al. 2020; Lofthouse et al. 2020; Fossati et al. 2021), the Cosmic Ultraviolet Baryon Survey (CUBS) (e.g., Boettcher et al. 2021; Cooper et al. 2021; Zahedy et al. 2021), and studies with the Keck/KCWI optical IFS (e.g., Martin et al. 2019; Nielsen et al. 2020) have extended these insights to higher redshifts, broader dynamic ranges, and higher spectral resolution.
While significant progress has been made in studying the ionised and neutral atomic components of the CGM, the molecular gas content remains less explored. Molecular gas is a critical ingredient for star formation, and is closely connected with gas accretion and star formation (Tacconi et al. 2020; Walter et al. 2020; Saintonge & Catinella 2022). Observations with the Atacama Large Millimetre/submillimeter Array (ALMA), Northern Extended Millimeter Array (NOEMA), and Jansky Very Large Array (JVLA) have opened new avenues to detect molecular gas in and around galaxies. Previous works have hinted at long gas depletion timescales and suppressed star formation efficiencies in some H I–selected systems, which suggest there is a distinct phase of galaxy evolution not well represented in emission–selected surveys (e.g., Kanekar et al. 2018, 2020; Neeleman et al. 2017, 2018, 2019; Klitsch et al. 2019; Péroux et al. 2019; Szakacs et al. 2021; Kaur et al. 2021, 2024). However, a systematic study of the molecular gas content of H I–selected galaxies with multi-wavelength data is still lacking.
The MUSE-ALMA Haloes survey was designed to probe the multi-phase nature of the CGM by targeting 32 H I Lyα absorbers with column densities in the range log N(H I)/cm2 = 18.1 − 21.7 at redshifts 0.2 < z < 1.4. It combines new observations from MUSE on the VLT, ALMA, and HST. The scientific development of the survey builds on previous work and initial results based on smaller subsamples of H I absorbers. These early studies, using precursor observations, investigated the environments of absorbers, and revealed intragroup associations and multi-galaxy systems (Péroux et al. 2017, 2019), evidence of cold accretion (Rahmani et al. 2018a), outflows (Rahmani et al. 2018b), and extended molecular gas beyond the ionised discs (Klitsch et al. 2018). Kinematic alignment between molecular and ionised gas phases was explored by Szakacs et al. (2021), while Hamanowicz et al. (2020) reported absorber–galaxy correlations based on 14 systems. The full statistical analysis of the MUSE data was presented by Weng et al. (2022), who identified 79 galaxies within ±500 km/s of the absorbers in 19 MUSE fields, each covering a 1 × 1 arcmin2 field of view, this provides the first comprehensive view of CGM galaxy environments in this sample. These 79 galaxies form the basis of the MUSE-ALMA Haloes survey sample (Péroux et al. 2022), on which subsequent studies have built. Karki et al. (2023) found that these absorption-selected galaxies lie on the star-forming main sequence with a 2σ scatter, and that higher H I column densities tend to be associated with more compact galaxies. They also showed that both emission and absorption metallicities correlate with stellar mass and specific star formation rate (SFR), which suggests that metal-poor absorbers trace galaxies with lower past star formation and more rapid current gas consumption. Weng et al. (2023a) applied 3D forward modelling of the ionised gas kinematics to explore the physical origins of the absorbers. In parallel, Weng et al. (2024) used the TNG50 simulation to track H I absorbers around galaxies at z = 0.5, and found that many absorbers at large impact parameters or low column densities arise from satellites, neighbouring haloes, or the intragalactic medium. Augustin et al. (2024) examined the stellar mass distribution of the sample, and report an anti-correlation between stellar mass and H I column density, which suggests that more massive galaxies are surrounded by less neutral hydrogen. Finally, Karki et al. (submitted) investigated 20 interacting galaxies associated with quasar absorbers, and show that tidal features trace galaxy-CGM interactions, and they relevealed enhanced star formation, distinct kinematics, and extended CGM properties compared to non-interacting systems.
This paper presents the first results of an ALMA Large Program for MUSE-ALMA Haloes survey (Cycle 10, PI: C. Péroux), that targeted galaxies selected as H I absorbers. The science goals of this survey include identifying the role of the molecular gas in H I-rich galaxies, comparing with the canonical scaling relations, and exploring their connection to other galaxy properties. By comparing their depletion timescales, mass-metallicity relations, and physical diversity with other galaxy populations, we aim to better understand the physical conditions that govern the efficiency of gas conversion into stars.
This paper is organised as follows. In Section 2, we describe the MUSE-ALMA Haloes ALMA Large Program and summarise the science goals achieved with this multi-wavelength dataset. Section 3 details our analysis and results. Section 4 presents the properties of H I–selected systems and compares our findings with existing literature. Section 5 discusses the nature of H I–selected galaxies. In Section 6, we summarise our key conclusions. Throughout this paper, we use H0 = 70 kms−1Mpc−1, ΩM = 0.3, and ΩΛ = 0.7. The present-day cosmological critical density is ρ0, crit ≃ 277.4 h2 M⊙ kpc−3. We adopt log Z = 12 + log(O/H)PP04 following Pettini & Pagel (2004) and refer to it simply as 12 + log(O/H).
2. Multi-wavelength data
The analysis in this paper builds upon the extensive dataset assembled by the MUSE-ALMA Haloes survey (Péroux et al. 2022). In this section, we provide a brief overview of the ancillary datasets from VLT/UVES, VLT/MUSE, HST, and ALMA, and introduce the new ALMA observations obtained as part of a Cycle 10 Large Program (PI: C. Péroux, ID: 2023.1.00127.L). This rich dataset enables a comprehensive characterisation of the stellar, ionised, atomic, and molecular gas properties of absorption-selected galaxies, offering new insights into the baryon cycle and the physical processes governing galaxy evolution.
The MUSE-ALMA Haloes survey has measured absorber redshifts, H I column densities from Voigt profile fitting of high-resolution quasar spectra, and metal abundances of the absorbing gas. Within the MUSE field of view, a total of 3658 extra-galactic sources were found across all the fields, of which 79 galaxies were identified within ±500 km/s of the absorbers and ranging from 8 to > 100 kpc in projected separation Weng et al. (2023b). From galaxy morphologies, position angles and inclinations were used to calculate azimuthal angles between galaxies and background quasars (Hamanowicz et al. 2020; Péroux et al. 2022; Weng et al. 2023a).
2.1. Ancillary optical observations
2.1.1. VLT observations
Observations from the Very Large Telescope (VLT) Multi-Unit Spectroscopic Explorer (MUSE) in 19 quasar fields enabled the identification of 79 galaxies associated with strong H I absorbers at intermediate redshifts (z ∼ 0.5) (Weng et al. 2022) (PIs: Péroux; ESO programs 96.A-0303, 100.A-0753, 101.A-0660, 102.A-0370, and Klitsch 298.A-0517). Spatially resolved MUSE spectroscopy provided rest-frame optical emission lines ([O II], Hβ, [O III], Hα, [N II]), yielding spectroscopic redshifts, star formation rates, and gas-phase metallicities via strong-line diagnostics calibrated by Curti et al. (2017) and Maiolino et al. (2008).
Complementary new high-resolution quasar spectroscopy from VLT/UVES (PI: Péroux, ID: 113.A-0369), along with archival Keck/HIRES and VLT/X-Shooter data, provides detailed measurements of metal absorption lines (e.g., Fe II, Si II, Zn II, C IV). Column density estimates offer dust and ionisation corrections, and CGM metallicity measurements in neutral gas absorption from Voigt profile fitting (Weng et al. 2023a; Karki et al. 2023; Augustin et al. 2024; Halley et al., in prep.).
2.1.2. HST observations
The HST ancillary data come primarily from broad-band imaging observed with the Wide Field Camera 3 (WFC3) during Cycle 27 under GO Program ID 15939 (PI: Péroux) using both optical (UVIS) and infrared (IR) detectors, as well as archival data from the Wide Field and Planetary Camera-2 (WFPC2) and WFC3 from programs 5098, 5143, 5351, 6557, 7329, 7451, 9173, and 14 594 (PIs: Burbidge, Macchetto, Bergeron, Steidel, Malkan, Smette, Bechtold, Bielby). For a comprehensive description of the observational setup, data reduction, PSF subtraction, photometric measurements, and the master table of all targets, see Péroux et al. (2022). The high spatial resolution of HST imaging (resolution ∼0.04″) provided a crucial complement to MUSE observations, enabling the identification of structural features such as tidal tails and galaxy morphologies (Karki et al. 2023).
Augustin et al. (2024) performed spectral energy distribution (SED) fitting on the multi-band HST photometry using the LE PHARE code (Arnouts et al. 1999; Ilbert et al. 2006). The fitting assumed Bruzual & Charlot (2003) SED templates, a Calzetti et al. (1994) dust extinction law, and a Chabrier (2003) initial mass function. The resulting stellar mass measurements span a wide range from log(M★/M⊙) = 7.8 − 12.4, highlighting the diversity of galaxies associated with H I absorbers. The most robust mass determinations (34 galaxies) had at least two detections in different HST filters, with higher-mass galaxies (log(M★/M⊙) > 10) typically having more reliable measurements due to their stronger detections across multiple bands.
2.2. ALMA observations
2.2.1. Previous ALMA data
In addition to the rich optical and UV dataset, we compile sub-millimetre observations from archival data. Kanekar et al. (2018) observed one absorber associated with one galaxy included in the MUSE-ALMA Haloes survey in the quasar field J0138-0005. The ALMA observations in Band 4 (program IDs: 2013.1.01178.S, 2015.1.00561.S, PIs: J. Prochaska, N. Kanekar) targeted the CO(2–1) line. They performed data reduction in the Common Astronomy Software Applications (CASA, McMullin et al. 2007), using tclean with a natural weighting, producing cubes with a spectral resolution of 100 km s−1 and a rms noise of ∼0.20 mJy beam−1 in the data cubes. They placed an upper limit on the CO luminosity for the galaxy associated with the absorber.
Klitsch et al. (2018) used ALMA calibrator data from the ALMACAL survey (Zwaan et al. 2022; Bollo et al. 2024) for quasar J0423-0130, linked to four galaxies from the MUSE-ALMA Haloes survey. They analysed CO(2–1) and CO(3–2) lines from Band 4 and Band 6 data (1333 s and 605 s total), reduced with CASA (Briggs weighting), achieving velocity resolutions of 33 and 22 km s−1, and the rms noise levels in the data cubes are ∼0.28 and ∼0.37 mJy beam−1, respectively. One detection was reported, with two upper limits and one source outside the ALMA field of view.
Four quasar fields (Q1232-0224, Q0152-2001, Q1211+1030, and Q1130–1449) were observed with ALMA to cover CO(2–1) or CO(3–2) under the programs 2016.1.01250.S and 2017.1.00571.S (PI: C. Péroux) and 2018.1.01575.S (PI: A. Klitsch), presented in Péroux et al. (2019) and Szakacs et al. (2021). The programs targeted 17 galaxies included in the MUSE-ALMA Haloes survey, which had been identified by MUSE and associated with absorbers at z ∼ 0.4 with impact parameters ranging from 8 to 82 kpc. The primary spectral window was centred on the redshifted CO(3−2) frequency (345.796 GHz) in high spectral resolution mode, complemented by three additional spectral windows in low resolution mode (31.250 MHz). They performed data reduction in CASA, using tclean with a Briggs weighting scheme, reaching a spectral resolution of 50 km s−1 per channel and an RMS sensitivity of 0.28 mJy beam−1. They reported two detections out of the 17 systems that are part of the MUSE-ALMA Haloes survey.
In total, we compiled ALMA archival data for 21 galaxies from the MUSE–ALMA Haloes Survey, all of which were observed in the CO(2−1) or CO(3−2) transitions. By design of the MUSE-ALMA Haloes survey, they have MUSE and HST data, as mentioned earlier in the text.
2.2.2. MUSE-ALMA Haloes ALMA Large Program
The ALMA data presented in this paper were obtained from the ALMA Large Program (2023.1.00127.L, Cycle 10, PI: C. Péroux). The observations were conducted between December 2023 and March 2024 using ALMA configurations C43-2, C43-3, and C43-4, which provided angular resolutions ranging from 0.6″ to 1.1″ at the observed frequencies.
This program targeted CO emission lines (specifically CO(2−1), CO(3−2), CO(4−3) transitions) using Band 4 (125 − 163 GHz) and Band 6 (211 − 275 GHz), reaching a rms of 0.16 mJy beam−1 over 50 km s−1. Our sample consists of 39 H I-rich galaxies associated with 17 quasar absorbers with known H I column densities (log N(H I) > 1018 cm−2) at redshifts 0.3 ≲ z ≲ 1.2 (Péroux et al. 2022). This sample is drawn from the full parent sample of 79 galaxies identified in the MUSE data (Weng et al. 2022). Of these 79 galaxies, 60 have been observed with ALMA to date: 39 in the present Large Program and 21 from pilot studies and archival data. The remaining 19 galaxies that have not yet been observed were not excluded for scientific reasons; rather, the Large Program strategy was designed to optimise telescope time by prioritising galaxies based on redshift and by targeting multiple absorbers within the same pointing.
The data were calibrated and imaged using the standard ALMA pipeline in CASA (version 6.5.6), with phase and/or amplitude self-calibration applied to five fields where the background quasar was bright enough (> 5 mJy) to achieve a signal-to-noise ratio of five. The time interval used in gaincal varied from target to target, depending on the quasar flux density: in the most favourable cases, we used 30 s for phase-only self-calibration and 60 s for combined amplitude-and-phase calibration, while for the faintest sources, the solution interval corresponds to the full scan length. The images were built using tclean with pixel sizes adjusted according to the synthesised beam and a natural weighting scheme. Following these calibrations, we performed continuum subtraction only in one field (Q2131-1207), to mitigate low-level artefacts associated with the presence of a bright quasar in the field, using uvcontsub with a polynomial order of 2. Although higher than the commonly adopted zeroth- or first-order fits, the resulting continuum model is effectively linear across the ALMA spectral window. The difference between the first- and second-order continuum models is at the ∼10−7 Jy level in the image domain, far below the noise level of the data, indicating that the quadratic term does not introduce any artificial curvature or spurious structure. Tests on all fields confirm that the effect of the quadratic term is negligible, so no bias is introduced in the extracted spectra. The final data cubes were produced and corrected for primary beam effects using impbcor. Final data cubes were created with ∼60 km/s spectral binning for optimal line sensitivity. Full details of the observations, calibration procedures, and data quality assessments are presented in a separate paper (Péroux et al., in prep.). All subsequent analyses are based on data from the complete MUSE-ALMA Haloes survey.
3. Analysis and results
3.1. Emission line search identification
We systematically searched for CO emission lines within the calibrated and cleaned ALMA data cubes. The search used two complementary approaches to maximise completeness while maintaining reliability.
First, we conducted a targeted search at the expected positions of 39 H I–selected galaxies previously identified in Weng et al. (2022). For each galaxy, we applied a systematic aperture optimisation procedure to maximise the likelihood of detecting CO emission. We used elliptical apertures with semi-major and semi-minor axes ranging from 1 to 4 times the synthesised beam size. For each aperture size, we rotated the ellipse from 0° to 90° in steps of 5°, systematically exploring different orientations. At each combination of size and angle, we extracted spectra and computed the signal-to-noise ratio (S/N), estimated from the integrated line flux over the beam size, to identify the configuration that maximised the signal significance. This method allowed us to capture the full extent of potentially resolved CO emissions. We defined emission line candidates where the signal exceeded 3σ in at least one channel (∼60 km s−1), where σ represents the RMS noise level measured in regions of the cube without emission, which is the minimum expected line width based on detection for the previous ALMA data (Sect. 2.2). The aperture optimisation procedure increases the effective parameter space explored and can therefore detect spurious ≥3σ features (known as the look-elsewhere effect). To quantify this, we implemented a test in which the same aperture optimisation procedure was applied to 500 random positions within emission-free regions of the cubes. From this analysis, we determined the frequency of spurious ≥3σ detections and used it to assess the fidelity of our detection threshold. Based on this calculation, we report a detection threshold corresponding to a fidelity of > 90%. The aperture optimisation technique allowed us to successfully detect CO emission lines in nine sources from our targeted sample.
In parallel, we performed a blind search across all the fields using the Source Finding Application SOFIA-2 (Serra et al. 2015; Westmeier et al. 2021) that uses a number of different source detection algorithms to find emission lines in radio data cubes. In this process, we used the data cubes, not corrected from the primary beam, to model the noise level homogeneously across the field of view. We use the Smooth + Clip Finder, which smooths the data in both spatial and spectral directions using several 3D smoothing kernels. Our setup consisted of a detection threshold of 3σ, a minimum requirement of emission spanning one channel, and a reliability estimated by SOFIA-2 of 0.9, which compares the distribution of positive and negative sources in parameter space, defined by signal-to-noise ratio and line width. This blind search recovered six sources coincident with our primary targets, thereby providing an independent confirmation of the majority of our targeted detections. The three targeted sources not identified by SOFIA-2 correspond to lower S/N (< 5) lines located near the edges of the primary beam, where the sensitivity drops and the reliability of blind searches decreases. We stress that the aim here is not to derive a blind detection rate, which requires a careful assessment of the false-positive rate and completeness, but rather to provide an independent check on our targeted search results. Finally, this exercise demonstrates the potential of the dataset for a fully blind search. In addition to confirming targeted detections, the algorithm also identified several candidate CO emitters without optical counterparts. A full analysis of these serendipitous detections, including a detailed fidelity assessment of the blind search, will be presented in future work.
In total, we detected CO emission from nine galaxies at a significance of at least 3σ out of our targeted sample of 39. For the remaining 30 sources, we calculated 3σ upper limits based on the sensitivity reached in the data cube and assuming a line width of 200 km/s, typical for galaxies in our sample. These are stringent limits due to the depth of our survey.
When combined with previous CO observations from the MUSE-ALMA Haloes survey (Kanekar et al. 2018; Klitsch et al. 2018; Szakacs et al. 2021), which added three detections and eighteen upper limits, our comprehensive analysis provides a total of 12 CO detections out of 60 galaxies at 0.3 < z < 1.2, as shown in the left panel of Figure 1. Before the MUSE-ALMA Haloes survey, only a handful of H I at z ∼ 0.5 had been targeted in CO (e.g., Kanekar et al. 2018). Our observations increased the number of targeted galaxies by a factor of 5 and nearly doubled the number of CO detections ever previously known. Figure 2 shows the resulting moment map and extracted spectrum for each detected source.
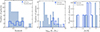 |
Fig. 1. Distribution of CO detections (blue) and non-CO detections (light blue) on galaxies as a function of redshift (left) and stellar mass (middle). The right panel is plotted as a function of metallicity corresponding to multiple galaxies associated with the absorbers (Halley et al., in prep). This figure represents the MUSE-ALMA Haloes survey, including all the sources from the new ALMA Large Program and previous ALMA data (see Section 2.2). The middle and right panels have fewer numbers because only those with reliable M★ and [M/H] determinations are included. The median values for the detections are 0.6, 9.66 and −1.23 for the redshift, stellar mass and absorption metallicity, while the non-detections have median values of 0.5, 9.16, and −1.84. Overall, we report no clear correlation between the detection rate and any of these properties, which suggests that the detection of CO emission may be governed by a combination of global galaxy properties, rather than just one property alone. |
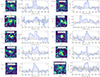 |
Fig. 2. CO detections and spectral profiles of the nine new detected sources. Left panels show the moment zero maps with the ±3, ±4, and ±5σ level contours, while the right panels display the extracted CO spectra. The grey shaded regions around each spectrum represent the ±1σ RMS noise level estimate from the individual data cubes, and the blue shaded region indicates the velocity range used to create the moment maps. The final row, right figure, presents the rest-frame stacked spectrum of non-detections with ±1σ and ±2σ levels. A summary of the integrated CO fluxes and associated uncertainties for all detected sources is provided in Table A.1 |
3.2. Non-detections stacking
We performed a spectral stacking analysis for the sources without individual CO detections. To ensure consistency in the transition being stacked, we restricted the analysis to the CO(2–1) line. As a result, we stacked 27 sub-cubes corresponding to the non-detected sources. For each galaxy, we extracted a subcube centred on the expected position of the galaxy, using a spatial size of 50 kpc at its redshift. The spectral axis spanned 1000 km s−1, centred on the expected frequency of the CO line. All subcubes were then rebinned and smoothed to the coarsest spatial and spectral resolution.
The cubes were stacked, averaging each subcube weighted by the square of the luminosity distance to account for flux dimming with redshift. This weighting helps recover a quantity closer to the intrinsic luminosity by correcting for the cosmological decrease in observed flux with distance. We also applied a weight given by the sensitivity of each data cube. We examined the resulting stacked cube for potential CO emission at the central position.
To extract the spectrum, we used a circular aperture, and the same aperture was used to estimate the significance of the emission line in the stacked cube. To quantify the noise, we extracted spectra from 100 random apertures placed across the stacked cube, excluding the central region. These apertures matched the size determined during optimisation. The per-channel error was then computed as the standard deviation across all 100 spectra. The resulting moment map and spectrum of the stacked cube are presented in the bottom right panel of Figure 2. The spectrum exceeds 3σ in two consecutive channels. We report a stacked CO emission line detected at a significance level of ∼4.2σ.
3.3. CO Luminosity
We calculated the CO luminosity from CO fluxes using the following equation from Solomon et al. (1997),
![Mathematical equation: $$ \begin{aligned} L\prime _{\mathrm{CO} } = 3.25 \times 10^7 \frac{F_{\mathrm{CO} }}{(1+z)^3} \left(\frac{D_{\mathrm{L} }}{\nu _{\mathrm{obs} }}\right)^2 \mathrm{[K km s} ^{-1} \mathrm{pc} ^2\mathrm{]} , \end{aligned} $$](/articles/aa/full_html/2026/03/aa56531-25/aa56531-25-eq1.gif) (1)
(1)
where L′CO is in units of K km s−1 pc2, νobs is the observed frequency of the CO line in GHz, DL is the luminosity distance of the galaxy in Mpc, z is the redshift, and FCO is the integrated flux in Jy km s−1. We converted the luminosity measured for mid- and high−J CO into CO(1−0), scaling by the empirical conversion factors from Fixsen et al. (1999), Weiß et al. (2005): rJ → 1={2.5, 3.5, 2.5}, for J = 2, 3, 4. These values were also assumed in previous ALMA observations of the MUSE-ALMA Haloes survey published by Kanekar et al. (2018), Szakacs et al. (2021), and we scaled the values from Klitsch et al. (2018) accordingly. Table A.1 shows the measured CO fluxes and full width at half maximum (FWHM) for all the detected sources. The FWHM was calculated from a Gaussian fit to the line profile, using the relation FWHM = 2.355 × σ, where σ is the standard deviation obtained from the fit.
3.4. Molecular gas mass
We derive the molecular gas mass of our sources using the CO(1–0) luminosity and the empirical conversion factor, αCO, following Tacconi et al. (2010):
 (2)
(2)
The conversion factor αCO increases with decreasing metallicity Z, since lower metallicity environments allow ultraviolet radiation to penetrate deeper into molecular clouds, leading to more extensive photodissociation of CO (Wolfire et al. 2010; Bolatto et al. 2013). From the different metallicity corrections proposed in the literature, we adopt the geometric mean of the recipes by Bolatto et al. (2013) and Genzel et al. (2012) as adopted by Genzel et al. (2015) and Tacconi et al. (2018):
![Mathematical equation: $$ \begin{aligned} \begin{aligned} \alpha _{\mathrm{CO} } =\;&4.36 \times \left[ 0.67 \times \exp \left(0.36 \times 10^{-(12 + \log (\mathrm{O} /\mathrm{H} ) - 8.67)}\right) \right. \\&\left. \times \; 10^{-1.27 \times (12 + \log (\mathrm{O} /\mathrm{H} ) - 8.67)} \right]^{1/2} \; [M_\odot /(\mathrm K\,km\,s^{-1}\,pc ^2)]. \end{aligned} \end{aligned} $$](/articles/aa/full_html/2026/03/aa56531-25/aa56531-25-eq3.gif) (3)
(3)
where 12 + log(O/H) is the metallicity on the Pettini & Pagel (2004) scale. Figure 3 shows the comparison of the different prescriptions proposed by Genzel et al. (2012), Bolatto et al. (2013), Accurso et al. (2017) and the adopted model for our sources from Genzel et al. (2015).
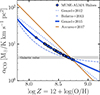 |
Fig. 3. Different αCO models across varying metallicites. In this work, we adopt the model proposed by Genzel et al. (2015), shown in the blue points, which corresponds to the geometric mean of the prescriptions of Bolatto et al. (2013) and Genzel et al. (2012), as indicated in Eq. (3). As a reference, we also include the model proposed by Accurso et al. (2017), which would lead to higher values for αCO for the galaxies in our sample. To prevent extrapolation into poorly constrained regions of parameter space, we impose an upper limit on αCO, set to the lowest emission metallicity measured in our sample, which leads to an αCO ∼ 15. |
The metallicities for our targets were derived by Weng et al. (2023b) using the R3 strong-line calibration (Curti et al. 2017, 2020), defined as R3 = log([O III] λ5007/Hβ). This method is applicable up to redshift z ∼ 0.85 and is largely unaffected by dust obscuration. For galaxies at z < 0.4, the O3N2 diagnostic (Pettini & Pagel 2004), given by log([O III] λ5007/Hβ)−log([N II] λ6584/Hα), was also measured to cross-check R3-based metallicities and, in some cases, resolve the degeneracy in the R3 indicator. Errors were estimated by propagating flux uncertainties and using Monte Carlo sampling to solve the metallicity calibration polynomial.
Out of the 39 galaxies included in the new ALMA observations, we have direct metallicity measurements for 24 from the MUSE data based on the optical emission lines to get the R3 auroral strong line calibration. For the remaining 15, stellar mass estimates are available for 13 galaxies, allowing us to infer their metallicities using the mass-metallicity relation (Pettini & Pagel 2004). To maintain consistency with previous studies (e.g., Saintonge et al. 2017; Tacconi et al. 2018), we use the following mass–metallicity relation:
 (4)
(4)
with b = 10.4 + 4.46 × log(1 + z) − 1.78 × (log(1 + z))2 (Genzel et al. 2015; Erb et al. 2006; Maiolino et al. 2008; Zahid et al. 2014; Wuyts et al. 2014). For the two galaxies without reliable stellar mass estimates (IDs: Q0454p039_15, Q0454p039_57), we investigated the metallicity estimated in absorption along the line of sight of a quasar background. The metal content of the absorbing gas is very poor ([M/H] ≲ − 1.0), so we take a lower limit in the metallicity set to the lowest observed value in our sample. This approach is more conservative than using an extrapolation of the prescriptions mentioned before, as the αCO quickly increases towards low metallicities. Using the lowest observed metallicity, we adopt an αCO ∼ 15 for the metal-poor regime. For sources from the literature, we reanalysed the MH2 estimates using an αCO value consistent with our methodology.
4. Properties of H I–selected galaxies
The selection of H I absorbers through absorption features in a background quasar spectrum allows the detection of diffuse, low-surface brightness neutral gas that often eludes direct emission observations due to the low density of gas (Wolfe et al. 2005; Prochaska et al. 2017). This method offers redshift-independent sensitivity, and in the case of DLAs yields accurate measurements of metallicity that are largely insensitive to temperature or ionisation conditions, unlike emission diagnostics (Pettini et al. 1999; Kulkarni et al. 2005; Lehner et al. 2013). For sub-DLAs and systems with log N(H I) < 19, we correct for dust depletion and ionisation effects following the approach of, e.g., Quiret et al. (2016), which ensures that the derived metallicities are reliable. A more detailed description of these corrections will be presented in a forthcoming paper (Halley et al., in prep.). In this section, we revise the properties of absorption-selected galaxies and relate them to their cold gas content.
4.1. Molecular gas detection rate
Despite the high neutral hydrogen column densities of the targeted absorbers in the MUSE-ALMA Haloes survey (log [N(H I)/cm2] ≳18), CO emission is detected in 12 out of 60 galaxies, which corresponds to a detection rate of 20%. Although this detection rate is lower than those reported in some previous studies (e.g., Klitsch et al. 2018), it represents a substantial number of detections drawn from a broader and less biased sample, as no metallicity-based preselection was applied. This represents a crucial step towards a more comprehensive understanding of molecular gas in absorption-selected galaxies.
Previous studies have reported high CO detection rates (> 60%), particularly in systems pre-selected for high metallicity or H2 absorption. For instance, Neeleman et al. (2016) reported CO(1−0) emission from a z ∼ 0.101 absorber-associated galaxy with a molecular gas mass of 4.2 × 10⁹ M⊙ and low star formation rate, indicating a long gas depletion timescale. Similarly, Møller et al. (2018) detected CO(2−1) in a highly metal-rich DLA galaxy at z = 0.716, finding a large molecular mass (∼2.3 × 10¹⁰ M⊙) but suppressed star formation, deviating from canonical SFR–MH2 scaling relations. These examples suggest that molecular gas-rich absorption-selected galaxies may undergo inefficient star formation, possibly due to environmental quenching. Kanekar et al. (2018) extended this trend with a sample of high-metallicity H I absorbers at z ∼ 0.5–0.8, detecting CO in five out of seven cases (detection rate > 70%). These galaxies have molecular gas masses from 0.6 to 8.2 × 10¹⁰ M⊙, again linked with modest star formation rates, reinforcing the idea of gas-rich but low-efficiency star-forming systems. Klitsch et al. (2021) found CO emission in five of six H2-bearing absorbers (detection rate > 80%), further supporting a strong link between H2 absorption and CO-rich galaxies, particularly in group environments or overdensities. They found no clear correlation between CO detection and absorber metallicity and concluded that H2 absorbers trace diffuse molecular gas in the CGM or intragroup medium, rather than the central disc. Further analysis by Klitsch et al. (2022) of the CO excitation in absorption-selected galaxies showed a broad range of ISM conditions, highlighting the heterogeneous nature of these systems and the complexity of relating CO luminosity to total H2 content.
Collectively, these findings suggest that absorption selected galaxies at z ≲ 1 showing CO emission, particularly at high metallicities, may represent a distinct population, characterised by substantial molecular gas reservoirs but often exhibiting suppressed or inefficient star formation activity relative to typical star-forming galaxies at similar epochs. However, these higher detection rates likely benefit from sample selections that favour CO-rich systems, such as selecting high-metallicity absorbers (Neeleman et al. 2018).
The MUSE-ALMA Haloes survey provides a complementary perspective. By selecting galaxies solely based on their H I absorption properties, without bias towards metallicity or known H2 content, the survey probes a broader galaxy population. Our ∼20% detection rate thus provides a more representative estimate of molecular gas occurrence in H I-rich systems at z ≲ 1, offering a statistically robust view of cold gas in the CGM and galaxy environments traced by quasar absorbers.
To further explore possible factors influencing CO detection, Figure 1 shows the distribution of CO detections and non-detections in galaxies as a function of redshift, stellar mass in the left and middle panels. In the third panel, this is plotted as a function of metallicity corresponding to multiple galaxies to evaluate whether any galaxy associated with the absorbers is detected in CO. We find no clear dependence of detection rate on any of these parameters, suggesting that the presence of CO-emitting molecular gas is not simply governed by global galaxy properties, like the absorber metallicity alone. This contrasts with studies that do find a correlation between absorber metallicity and CO detection rate, possibly because sub-DLA samples typically probe smaller impact parameters (e.g., Kanekar et al. 2018), where the absorber metallicity more directly traces the ISM metallicity of the associated galaxy. While such studies often implicitly assume a one-to-one correspondence between absorbers and galaxies, our observations reveal that several galaxies may contribute to the absorption seen along a single quasar sightline. In our case, the absence of metallicity preselection broadens the probed galaxy–absorber configurations, naturally diluting such correlations. However, recent results indicate that local conditions and environmental factors, such as gas density, pressure, or group dynamics, may play a more significant role in regulating cold molecular gas content in H I-selected systems (Lee et al. 2022). Since the presence of strong H I absorption along a quasar sightline reveals substantial column densities of neutral gas in the CGM or ISM of the associated galaxy, it is reasonable to compare our sample with H I-rich galaxies studied in emission at low redshift, without excluding that absorption selection may capture a broader range of gas properties.
4.2. Absorber-galaxy connection
The absorbers in the MUSE-ALMA Haloes survey span a range in H I column density of log [N(H I)/cm2] ∼18 − 22, covering systems from below the sub-DLA threshold to the DLA regime. We note that including absorbers below the canonical sub-DLA limit (log N(H I) = 19.0) allows us to probe a broader population of gas-rich systems, while comparisons with literature samples restricted to (sub-)DLAs should be treated with this caveat in mind. Within our sample, the detection rate of CO emission appears consistent across both the sub-DLA and lower-column-density regimes, as illustrated in the left panel of Figure 4. Systems with high N(H I) (≥1021 cm−2) are not necessarily associated with large molecular reservoirs, and conversely, galaxies with substantial MH2 can show relatively modest N(H I) values in absorption. This suggests that the absorbing H I gas, while indicative of the presence of neutral material, does not reliably trace the spatially integrated cold molecular gas content. This conclusion is consistent with the findings of Klitsch et al. (2021) in a sample of H2-bearing absorbers, where despite the high CO detection rate, they also report no clear correlation between N(H I), molecular gas fraction, or impact parameter and the host galaxy’s total MH2.
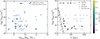 |
Fig. 4. Left: Molecular gas mass (MH2) as a function of H I column density (NHI). Blue circles represent our sample in comparison with previous studies on H I-absorption selected systems from Kanekar et al. (2018) and Klitsch et al. (2021), shown in grey. Right: NHI and impact parameter, colour-coded by the molecular gas masses. In this plot, we include all impact parameters for the sources in our sample, rather than limiting to the smallest b as done in previous studies (e.g. Péroux et al. 2016; Hamanowicz et al. 2020; Weng et al. 2022). The circles represent CO detections, and the triangle represents non-CO detections. We also include the median radial profiles for the neutral hydrogen column density from the simulations by van de Voort et al. (2019) and Nelson et al. (2020) in the dashed and dotted lines, respectively. We report no clear correlation between the column density and impact parameter for different molecular gas masses. |
Our detections span a broad range of impact parameters (from ∼40 to 180 kpc), and again, we observe no significant trend between impact parameter and MH2 or N(H I). Some systems with large molecular reservoirs are found at relatively large projected separations, while others close to the quasar sightline show little molecular gas. Moreover, when examining N(H I) versus impact parameter colour-coded by MH2, shown in the right panel of Figure 4, we find no coherent trend. As a reference, we also include the results from the Auriga zoom-in simulations of a Milky Way-mass galaxy (van de Voort et al. 2019), and from the post-processing of TNG50 around massive haloes (∼1013.5 M⊙) at z ∼ 0.5 (Nelson et al. 2020). Systems with similar impact parameters exhibit large scatter in both N(H I) and molecular mass, supporting the notion that the location and kinematics of absorbing gas are not strongly tied to the total molecular reservoir of the galaxy. Note that, unlike typical comparisons of these two quantities (e.g. Péroux et al. 2016; Hamanowicz et al. 2020; Weng et al. 2022), we do not restrict the plot to only the smallest impact parameter. In contrast, Klimenko et al. (2023) identified a strong correlation between N(H I) and impact parameter, found that absorber metallicities matched the emission metallicity gradients derived from integral field spectroscopy (IFS), and reported evidence of co-rotation between absorbing gas and galaxy discs extending out to ∼10 effective radii. These results suggest that, in some systems, absorbing gas can trace structured, rotating components of the CGM. However, such coherence is not observed across our full sample. Additionally, Augustin et al. (2024) found an anti-correlation between the stellar mass of host galaxies and the N(H I) of associated absorbers. These findings indicate an evolutionary trend in the CGM composition with stellar mass, where lower-mass galaxies tend to host haloes rich in cool, dense H I gas, while higher-mass systems show a depletion of such gas.
Out of the 12 galaxies with detected CO emission, all but one (ID Q0152m2001_12) are embedded in environments where other galaxies are present at similar redshifts. This supports the idea that molecular gas is not only a feature of individual galaxies, but also a product of their interaction with the surrounding cosmic web and galaxy associations, consistent with earlier findings Klitsch et al. (2019), Hamanowicz et al. (2020). This environmental connection may facilitate the accumulation or retention of molecular gas through processes such as galaxy-galaxy interactions or group-scale gas accretion. Gravitational interactions can funnel and compress gas, increasing the molecular gas reservoir, while group environments enable continuous gas inflow and help prevent gas loss due to their deeper potential wells. This can lead to galaxies that harbour large amounts of molecular gas but exhibit relatively low star formation rates, suggesting that environmental factors may promote gas buildup without immediately triggering efficient star formation. Moreover, gas flow geometry derived from MUSE data (Weng et al. 2022) reveals that some of these CO-rich systems are linked to inflows (e.g., Q0152m2001_12 and Q2131m1207_5 at ∼50 kpc), while others, such as Q1229m021_8 at ∼120 kpc, show outflow-like kinematics, indicating that molecular gas can be present in galaxies that are both accreting and expelling material, depending on the galaxy’s location and dynamics within its environment.
4.3. H I absorption selected-galaxies compared to star-forming populations
To contextualise our sample, we compared the properties of the host galaxies associated with the absorbers with the well-established galaxy scaling relations. We used a subsample of 89 galaxies at 0.3 < z < 1.2 from the PHIBSS survey (Tacconi et al. 2018) ranging in stellar mass from 109.8 to 1011.8 M⊙ and the full sample from xCOLD GASS (Saintonge et al. 2017) at z ∼ 0 ranging in stellar mass from 109 to 1011.3 M⊙, which is considered representative of the local galaxy population. In Figure 5, the left panel shows star formation rate (SFR) as a function of molecular gas mass (MH2), while the right panel shows the stellar mass against MH2. We distinguish the MUSE-ALMA Haloes (blue circles) from other literature H I–selected galaxies (grey points) from Kanekar et al. (2018) and Klitsch et al. (2019), while the red and orange circles represent the PHIBSS and xCOLD GASS samples, respectively. The SFR in our sample is derived from MUSE emission lines (Hα and [O III] when Hα is unavailable, Weng et al. 2022). PHIBSS SFRs combine UV and IR luminosities to account for obscured and unobscured star formation, while xCOLD GASS uses SDSS emission lines, GALEX UV, and WISE IR photometry. Despite minor differences in methodology and dust corrections, the SFRs are broadly consistent across samples, allowing a fair comparison in Figure 5.
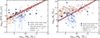 |
Fig. 5. Left: Star formation rate as a function of molecular gas mass (MH2). Right: Stellar mass (M★) as a function of molecular gas mass (MH2). Our sample is shown in blue circles, and the blue arrows represent a 3σ upper limit. The result from the stacked spectrum described in Sect. 3.2 is shown by the blue star. We also include the mean dust correction for SFR depicted by a large blue arrow on the corner of the left panel. For comparison, we include data from the xCOLD GASS survey (Saintonge et al. 2017), which represents low-redshift galaxies, and the PHIBSS survey (Tacconi et al. 2018), in the redshift range z ∼ 0.3 − 1.2. The solid line represents the molecular gas main sequence scaling relation from Tacconi et al. (2018). We also included estimates from Kanekar et al. (2018) and Klitsch et al. (2021) in both panels, labelled as other H I–selected systems. Our sources with MH2/M⊙ ≲ 109.8 lie ∼0.3 dex above the expected SFR−MH2 relations for ‘normal star-forming galaxies’ at the same redshift range, while the systems with with MH2/M⊙ > 109.8 lie ∼1.5 dex below the relation. This trend suggests that H I–selected systems have a dual behaviour. Galaxies with low molecular gas masses form stars efficiently, following both the depletion timescales and the M★ − MH2 scaling relations of main-sequence galaxies. In contrast, galaxies with high molecular gas masses show inefficient star formation and fall below the expected stellar mass growth, likely because they are still actively accreting gas from the intergalactic medium or interacting within group environments. These systems appear not yet to have reached the equilibrium conditions characteristic of main-sequence galaxies. |
Our H I–selected galaxies span the same general parameter space as emission-selected galaxies. At fixed MH2, we find a clear dependence of SFR offset on molecular gas mass (Figure 5, left panel). Galaxies with low molecular gas content (log MH2 ≲ 9.8) lie slightly above (∼0.3 dex) the scaling relation for normal star-forming galaxies at the same redshift range (Tacconi et al. 2018), shown by the solid red line. In contrast, galaxies with high molecular gas content (log MH2 > 9.8) are typically below the scaling relation by ∼1.5 dex. This indicates that while low-MH2 galaxies are relatively efficient in forming stars, high-MH2 galaxies host abundant molecular gas, which is yet to form stars. Even accounting for dust corrections (blue upwards arrow), which increases the SFR by ∼0.24 dex on average, the offset in high-MH2 systems remains significant.
We investigate the stellar mass–molecular gas mass (M★ − MH2) relation in the context of the MUSE–ALMA Haloes survey. As shown in the right panel of Figure 5, there is a systematic offset in this scaling relation for galaxies selected via H I absorption for the high- and low-molecular gas mass regimes, compared to the main sequence of star-forming galaxies at similar redshifts. Galaxies with low molecular gas content (log MH2 ≲ 9.8) lie on average ∼0.9 dex above the reference relation, indicating they are relatively massive in stars for their gas content. Conversely, galaxies with high molecular gas content (log MH2 > 9.8) lie ∼1.5 dex below the reference relation, implying that they host abundant molecular gas relative to their comparatively low stellar masses.
We examine the molecular gas mass-metallicity relation for our H I–selected sample, as shown in the left panel of Figure 6. We use the derived gas-phase metallicities from nebular lines presented in Weng et al. (2022), and compare these with molecular gas masses for the CO-detected systems. The CO-detected galaxies in our sample generally follow the same locus as normal star-forming galaxies in the molecular gas mass–metallicity plane. Most of the non-detections lie at lower metallicities, falling below the expected trend for their gas content. This suggests that emission metallicity may influence the detectability of molecular gas via CO lines, since CO is easily photo-dissociated in low metallicity environments, and there may be a lot of molecular gas that is not traced by CO (e.g. Madden et al. 2020). To quantify this, we construct an emission metallicity distribution for both CO detections and non-detections as shown in the right panel of Figure 6. A Kolmogorov–Smirnov (KS) test reveals a statistically significant difference between the two populations, with a p-value of 0.004. This indicates that the metallicity distributions of the CO-detected and CO non-detected galaxies are unlikely to be drawn from the same parent population.
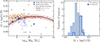 |
Fig. 6. Left: Nebular emission metallicity, 12 + log(O/H) (Weng et al. 2023b), as a function of molecular gas mass (MH2) for our H I–selected galaxies. Blue circles indicate CO detections, and blue leftwards arrows show 3σ upper limits for CO non-detections. The result from the stacked spectrum described in Sect. 3.2 is shown by the blue star. The solid line indicates the mass-metallicity relation from Genzel et al. (2015) for the PHIBSS sample (Tacconi et al. 2018). A positive correlation emerges between metallicity and CO detectability, with CO-detected galaxies tending to occupy the higher-metallicity regime (log Z ≳ 8.5), as found previously in many studies (e.g., Bolatto et al. 2013). Right: Histogram of emission metallicities for all galaxies, with CO detections in blue and non-detections in light blue filled histogram. The dashed orange line indicates a metallicity log Z ∼ 8.5, which sets the higher and lower metallicity regimes discussed in Sect. 5. Although the distributions overlap significantly, a two-sample Kolmogorov-Smirnov test yields a p-value of 0.004, which indicates a statistically significant difference in the underlying metallicity distributions. This reinforces the interpretation that metallicity plays a key role in governing the observability of molecular gas in H I–selected systems. |
5. Discussion
5.1. Implication of CO detections for H I–selected samples
Understanding the possible relation between H I-absorption selected galaxies and their CO emission is essential to interpret their physical properties in a wider context. Several studies have suggested a trend between high-metallicity absorption systems and CO emitters at z < 1 (e.g., Kanekar et al. 2018; Møller et al. 2018; Klitsch et al. 2021). Interestingly, this trend at high redshift (z ≥ 2) has also been explored. CO emission has been detected in ∼7 out of ∼20 DLA fields surveyed to date, with detection predominantly arising in systems with relatively high metallicities ([M/H]≥ − 0.72) and large molecular gas masses (Mmol ≥ 5 × 10¹⁰ M⊙). For instance, Neeleman et al. (2018) reported the detection of CO(3–2) and far-infrared continuum emission from a galaxy associated with a DLA at z = 2.192. Located at an impact parameter of 30 kpc from the quasar sightline, the galaxy exhibits a dust-corrected star formation rate (SFR) of ∼110M⊙ yr−1 and a molecular gas mass of ∼1.4 × 10¹¹ M⊙. Kanekar et al. (2020) conducted a systematic ALMA survey of 12 high-metallicity DLAs (z ∼ 1.7–2.6), detecting CO emission in five fields. The galaxies have molecular gas masses ranging from 1.3 ×10¹⁰ to 2.1 ×10¹¹ M⊙ and impact parameters between 5.6 and 100 kpc. The study confirmed a strong correlation between DLA metallicity and the likelihood of CO detection, with high-metallicity systems more frequently associated with massive, gas-rich galaxies. In another example, Kaur et al. (2022) used NOEMA to detect CO(3–2) emission from the galaxy DLA0201+365g at z = 2.4604. The galaxy, located ∼7 kpc from the quasar sightline, was found to contain a molecular gas mass of ∼5 × 10¹⁰ M⊙. Despite its gas richness, the galaxy had an SFR upper limit of just 2.3 M⊙ yr−1, suggesting either significant dust obscuration or a long gas depletion timescale. Further support for large molecular gas reservoirs in H I–selected galaxies at high redshift comes from JVLA detections of CO(1–0) and CO(3–2) in two DLAs at z ≈ 2.193 and z ≈ 2.356 (Kaur et al. 2024, 2025). These galaxies exhibited CO velocity widths of ∼500–600 km s−1 and molecular gas masses approaching 1011 M⊙. Interestingly, while DLA1228–113g showed near-thermal excitation of mid-J CO transitions, DLA1020+2733g showed sub-thermal excitation, indicating a relatively low star formation surface density and possible differences in gas excitation and star formation efficiency. More recently, Neeleman et al. (2025) reported a [C II] detection rate of > 70% for galaxies at z ∼ 4.1 − 4.5 selected to have an absorption metallicity [M/H] > −1.5.
These studies have primarily targeted H2 absorbers or metal-rich DLAs and sub-DLAs, inherently biasing detections towards galaxies with high molecular gas content (MH2 ≳ 1010 M⊙). This strategy yields high detection rates, but it has also limited our understanding of the broader population of H I–selected systems. These systems with high molecular gas masses exhibit star formation activity that is not always balanced with their gas reservoirs, lying systematically below the star-forming main sequence in terms of depletion time. This behaviour suggests that H I absorption associated with metal-rich DLAs and sub-DLAs preferentially traces systems at particular evolutionary stages, either in early phases of gas accretion or in temporarily inefficient modes of star formation, not typically represented in flux-limited, emission-selected surveys (e.g., Kulkarni et al. 2005).
In contrast, the MUSE–ALMA Haloes survey does not preselect galaxies by metallicity when following up on their molecular gas content. In addition, our observations probe a factor of ∼1.2 dex deeper in MH2 than earlier absorber studies, reaching a regime where such galaxies would have been missed in previous surveys. The considerable number of non-detections enables our stacked analysis to yield a ∼3σ detection consistent with the scaling relations of normal star-forming galaxies and demonstrates the deep rms levels achieved by our survey.
The stringent detection limits in our sample probe the intermediate molecular gas mass range (Mmol ≲ 109 − 1010 M⊙), and notably, several non-detections occur in galaxies with high stellar masses (> 1010 M⊙). The lack of CO detections in most absorber-selected galaxies does not necessarily imply the absence of molecular gas. Instead, it likely reflects the presence of “CO-dark” molecular gas, defined as regions where H2 exists without detectable CO emission due to low metallicity, reduced dust shielding, or diffuse, extended gas distributions. This interpretation is supported by both theoretical models and observations of dwarf and metal-poor galaxies (Madden et al. 2020), which are frequently associated with high H I column density absorbers (e.g., York et al. 1986; Kulkarni et al. 2000). Physical conditions, such as sub-critical gas densities or beam dilution in extended, low-surface-brightness structures, can further suppress the observable CO. Simulations by Li et al. (2018) found that a large fraction of H2 resides in diffuse regions where gas densities are below the critical threshold required to excite CO transitions, where CO emission may be weak or absent. Observations by Smit et al. (2014) also demonstrated that CO-dark gas frequently occurs in filamentary structures, which can be overlooked in high-resolution surveys. If molecular gas is spatially extended with low surface brightness, the CO emission may be spread over a large area and diluted below the detection limits of the observing beam. Given that absorber-selected galaxies are biased towards tracing diffuse, metal-poor, or extended gas phases, the absence of CO detections is best explained not by a true lack of molecular gas but by its predominantly CO-dark nature. Overall, the environmental conditions and observational limitations strongly support the scenario in which CO-dark molecular gas dominates the molecular content in H I-selected systems.
An alternative explanation is that the H I-to-H2 transition itself is inefficient or delayed in these galaxies. The efficiency of converting atomic hydrogen to molecular hydrogen is a crucial bottleneck in the star formation process. Our observations might be suggesting that the H I-to-H2 transition is delayed in these systems, potentially due to sub-solar metallicities that reduce dust abundance and limit the shielding required for H2 formation. This is consistent with theoretical predictions by Krumholz et al. (2009) and Sternberg et al. (2014), which show that in low-metallicity environments, the H I-to-H2 transition can be suppressed or delayed, with timescales extending to tens or hundreds of Myr. Additionally, turbulent gas conditions can affect molecule formation. Simulations by Glover & Mac Low (2007) demonstrate that while turbulence can enhance local densities and promote H2 formation, it can also increase mixing and disrupt the formation process in lower-density regions, leading to longer conversion times. The presence of detectable CO emission in some of these systems suggests that at least partial molecular gas formation has occurred. However, the inefficiency in converting H I to H2 is likely due to low metallicity, a low dust-to-gas ratio, and disrupted interstellar medium conditions, leading to subdued star formation despite significant gas reservoirs.
5.2. Physical diversity of H I absorbers
The wide range of galaxy–absorber configurations in our sample emphasises the physical diversity inherent to H I–selected systems. Eleven of the 12 CO-detected galaxies are associated with additional galaxies at the same absorber redshift. This implies that absorption selection is particularly sensitive to complex environments, such as group-scale structures or filaments, rather than isolated field galaxies. Consistent with this, Klitsch et al. (2021) found that H2-bearing absorbers often trace overdensities or galaxy groups. Kinematic classifications from Weng et al. (2022) further reveal that the absorbing gas in several of these systems likely originates from outflows or inflows, rather than rotationally supported discs. Thus, the cold gas reservoirs probed via H I absorption are embedded in a diverse range of physical contexts, and absorption-selected galaxies do not represent a uniform or simple population.
While some of these galaxies, particularly those with low molecular gas masses (log MH2 < 9.8), are actively star forming and are roughly consistent with the trends for normal star-forming galaxies, others with high molecular gas masses show suppressed star formation relative to their gas reservoirs. The low-MH2 systems exhibit depletion times that are comparable to those of main-sequence galaxies at similar redshifts, as indicated by the light blue circles in Figure 7. This suggests that they represent more evolved systems that have already accumulated substantial stellar mass and are efficiently forming stars. By contrast, galaxies with high MH2 show a mismatch between SFR and MH2, implying that they lie well above the star formation ‘main sequence’ in depletion time, as shown in the blue points of Figure 7. Therefore, they form stars less efficiently than expected for their molecular gas mass by a factor of ∼1.2 dex, placing them in a slower, more quiescent evolutionary phase.
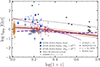 |
Fig. 7. Molecular gas depletion time (tdep = MH2/SFR) as a function of redshift for our H I–selected sample (blue circles for high molecular gas systems and light-blue for low molecular gas mass systems), compares with literature scaling relations and emission-selected samples (Saintonge et al. 2017; Tacconi et al. 2018). The result from the stacked spectrum described in Sect. 3.2 is shown by the blue star. The solid red curve shows the empirically derived tdep evolution for main-sequence galaxies from Tacconi et al. (2018), the dotted line marks the Hubble time at each redshift, the thin solid line represents the stellar mass doubling time (t* = M★/SFR) from Tacconi et al. (2020), and the dashed purple line is from the cosmic depletion timescales derived from the ALMACAL survey (Bollo et al. 2025). H I–selected galaxies, both from our sample and from high-redshift literature sources (grey dots; Klitsch et al. 2021; Neeleman et al. 2018, 2020, 2025; Fynbo et al. 2018; Kanekar et al. 2020, 2018; Kaur et al. 2022, 2025), consistently lie above the main-sequence relation, which indicates lower star formation efficiencies. Several galaxies exhibit tdep approaching or exceeding the Hubble time, which suggests inefficient molecular gas consumption or suppressed star formation. |
The stacking analysis reinforces this emerging picture: the stacked spectrum is consistent with the depletion times of normal star-forming galaxies, confirming that the observed suppression is confined to the most gas-rich individual systems. In the stack, the average molecular gas mass is estimated from the integrated CO flux of the combined spectrum, scaled by the mean redshift of the sample and adopting an αCO calibrated on the mean metallicity of the stacked systems. Similarly, the average SFR corresponds to the mean of the individual SFRs prior to stacking, ensuring that the stacked measurement reflects the typical star-formation level of the sample rather than being dominated by the brightest objects. For consistency, the metallicity shown in Fig. 6 is computed as the median of the individual gas-phase metallicities. It is worth noting that our deep ALMA observations push the molecular gas mass sensitivity by more than an order of magnitude lower than previous H I-selected studies, extending the probed regime towards galaxies with MH2 below 109 M⊙. This allows us to capture the diversity of gas properties, from more evolved, star-forming systems to inefficient, gas-rich galaxies.
As noted by Kanekar et al. (2018) and Klitsch et al. (2022), this apparent disconnect between molecular gas content and star formation activity points to environmental or dynamical suppression of star formation. Several mechanisms may contribute to the observed inefficiency of star formation in these systems. One possibility is that they are in an early phase of gas accretion, where molecular gas has recently condensed, but star formation has not yet fully ignited. Alternatively, internal feedback or environmental influences, such as turbulence, ram pressure, or low enrichment, may act to suppress or delay the conversion of gas into stars. In low-metallicity environments, an overestimated CO-to-H2 conversion factor (αCO) could also contribute to the apparent excess in molecular gas, though this alone is unlikely to explain the consistent suppression across multiple systems.
At the same time, our H I–selected galaxies with high MH2 have stellar masses generally lower than their molecular gas mass, being more gas-rich than typical emission-selected field galaxies of the same stellar mass. This offset supports the scenario of H I–selected systems being at an early stage of stellar mass buildup, possibly following recent gas accretion from filamentary structures or group environments. A similar offset was also reported by Kulkarni et al. (2022) in the H I versus stellar mass relation, which they interpreted as evidence for recent accretion fuelling the gas reservoirs in absorption-selected galaxies. These trends align with findings from other absorption-selected samples at similar MH2 (e.g., Neeleman et al. 2016, 2019; Kanekar et al. 2018), reinforcing the notion that H I absorbers trace both normal star forming galaxies and unusually gas-rich galaxies. Importantly, our deep observations also extend the parameter space by more than an order of magnitude towards lower stellar masses, allowing us to probe gas-rich galaxies below the stellar mass range typically reached by previous absorption- and emission-selected surveys.
Finally, the strong segregation in emission metallicity between CO-detected and non-detected galaxies adds further nuance to this picture. The detectability of CO is clearly influenced by metallicity, which governs the abundance and survival of CO relative to H2 in diffuse, unshielded regions (Bolatto et al. 2013; Schruba et al. 2012). Even when molecular gas is present, low-metallicity environments may have CO emission too faint to detect, particularly in the outskirts or CGM of galaxies. The fact that stellar mass and redshift distributions are comparable between CO detections and non-detections, while metallicity differs, suggests that local ISM conditions, such as enrichment, shielding, and density, are the primary regulators of molecular gas observability. This is consistent with both theoretical expectations and recent observational evidence emphasising the role of small-scale environmental factors in shaping cold gas content (e.g., Stern et al. 2016; Diemer et al. 2019).
5.3. Role in cosmic baryon cycle
Our analysis of H I–selected galaxies provides valuable insights into the cosmic baryon cycle, particularly regarding gas accretion, star formation efficiency, and the conversion of atomic to molecular gas. These systems, often overlooked in emission-selected surveys, provide a unique window into the processes governing galaxy evolution.
In the context of the equilibrium gas regulator model (Bouché et al. 2010; Forbes et al. 2014; Lilly et al. 2013; Tacchella et al. 2016), which describes the balance between gas inflow, star formation, and outflows, our H I–selected galaxies separate into two distinct regimes. Galaxies with low molecular gas masses (log MH2 ≲ 9.8) show depletion timescales that are shorter than the stellar mass doubling time (thin purple line in Figure 7), consistent with the regime where gas is consumed efficiently and star formation proceeds at rates similar to those of normal star-forming galaxies (thick solid line). In contrast, galaxies with high molecular gas masses (log MH2 > 9.8) exhibit significantly longer depletion timescales, well above t★, indicating inefficient star formation despite large gas reservoirs. These two regimes suggest that while some H I–selected galaxies are forming stars in a manner consistent with the gas regulator model, others accumulate molecular gas without efficiently converting it into stars, undergoing early stages of gas buildup or entering a temporarily inefficient star-forming phase.
The observed trend of depletion timescale with redshift in our sample of high molecular gas masses appears to persist across cosmic time. Several H I–selected galaxies at high redshift show unusually long depletion timescales, as shown in the grey points of Figure 7. We included estimates from Kaur et al. (2025), who report gas depletion timescales of ≳0.6 Gyr for a galaxy at z = 2.357 (DLA 1020+2733g), where the star formation rate (SFR) is only weakly constrained. Similarly, other z > 2 H I–selected galaxies, such as DLA1228-113g at z ≈ 2.193 with tdep ≈ 1.2 Gyr (Neeleman et al. 2018; Kaur et al. 2022), DLA 0918+1636g at z ≈ 2.5832 with tdep ≈ 0.5 Gyr (Fynbo et al. 2018; Kaur et al. 2022), and DLA 0817+1351g at z ≈ 4.258 with tdep ≈ 0.8 Gyr (Neeleman et al. 2020), also exhibit star formation efficiencies lower than those typical of main-sequence galaxies at similar redshifts, which often have depletion times as short as ∼0.2 Gyr. From the DLAs studies by Neeleman et al. (2025) at z > 4 and assuming that the [C II] luminosity is tracing the molecular gas reliably in normal star-forming galaxies (Zanella et al. 2018), we estimated their depletion timescales to range from tdep ∼ 0.53 to 1.8.
Although some H I selected systems show ∼1.5 dex higher molecular gas masses than normal star-forming galaxies, this does not necessarily indicate unusually gas-rich galaxies. Since these systems are selected based on strong H I absorption, a significant atomic gas component is expected (O’Beirne et al., in prep.). Supporting this, Messias et al. (2024) reports that the H I-to-H2 mass ratio remains ∼1 − 3 over a wide redshift range, implying that the molecular gas we observe likely coexists with comparable H I reservoirs. This suggests that some H I–selected galaxies occupy the upper range of total gas content, with large supplies of gas that are not yet fully ignited for star formation.
5.4. Implications for molecular gas simulations
The diversity in star formation efficiencies observed in H I-selected galaxies, with some systems consistent with normal star-forming galaxies and others showing significantly suppressed efficiencies, deviates from simple expectations of standard scaling relations. This dual behaviour presents new challenges and opportunities for theoretical modelling. Current cosmological simulations struggle to capture such diversity, particularly in predicting resolved CO emission in galaxies (Popping et al. 2019). While large-volume simulations (e.g., Keating et al. 2020; Inoue et al. 2020; Olsen et al. 2021; Pallottini et al. 2022) can reproduce global CO trends using sub-resolutions and post-processed radiative transfer models, they often lack the resolution and detailed physics required to track the formation and distribution of molecular gas self-consistently. To overcome these limitations, several recent studies have begun incorporating non-equilibrium chemistry solvers into high-resolution simulations of isolated or zoom-in galaxies (e.g., Richings & Schaye 2016; Lupi et al. 2018, 2020; Richings et al. 2022; Pallottini et al. 2022), enabling more realistic predictions of the CO-to-H2 abundances and star formation efficiencies across a range of galactic environments.
For example, Thompson et al. (2024) uses non-equilibrium chemistry with FIRE-2 simulations of isolated disc galaxies that can reproduce the observed CO-H2 and XCO-metallicity relations in the Milky Way and the xCOLD GASS sample. Similarly, Richings et al. (2022) shows that the H I-to-H2 transition is sensitive to local stellar radiation and dust depletions. Lupi et al. (2018, 2020) provide further insights through GIZMO+KROME simulations of isolated galaxies and the post-processing of cosmological boxes with CLOUDY. They demonstrate how local radiation fields and shielding strongly regulate molecular gas content and its link to star formation. This supports the interpretation that the CGM–ISM interface in our absorption-selected galaxies may host molecular gas not yet forming stars efficiently, possibly because local physical conditions such as turbulence, pressure balance, or radiative feedback inhibit star formation.
On cosmological scales, Maio et al. (2022) uses high-resolution simulations (ColdSim) with time-dependent non-equilibrium chemistry, capturing the evolution of H2 and depletion times from z ∼ 7 to 2. Their models reproduce the observed H I and H2 densities and show that even low-metallicity gas can form significant molecular fractions when self-shielded, which is consistent with the detection of CO in some of our low-metallicity systems. Meanwhile, Inoue et al. (2020) models molecular gas cloud populations within IllustrisTNG galaxies and computes CO line emission without relying on a fixed αCO. Their approach reproduces the CO luminosity functions at z ∼ 0 but finds that dwarf galaxies, often CO-dark, contribute non-negligibly to the molecular mass budget, a feature also observed in the metal-poor galaxies in our survey. Lastly, Olsen et al. (2021) presents SíGAME3, which models FIR emission from cosmological simulations with more detailed radiative transfer. Their models generally agree with observations but still overpredict CO luminosities, highlighting how emission-based diagnostics may be biased at low SFRs or in CGM-dominated regimes such as those we observe in our high-MH2, low-SFR systems.
In this context, the MUSE-ALMA Haloes survey’s empirical constraints on molecular gas content, star formation efficiency, and CGM structure offer a valuable dataset for informing and calibrating future simulations. Our results reveal a dual behaviour among absorption-selected galaxies: some systems exhibit star formation efficiencies comparable to the standard main-sequence of star-forming galaxies, while others remain inefficient at converting their sizeable molecular reservoirs into stars. This diversity highlights the need for new theoretical efforts to investigate how feedback, gas accretion, and environmental effects regulate the baryon cycle within and around galaxies, and to understand the physical mechanisms that drive galaxies into these distinct regimes.
6. Conclusions
Understanding the molecular gas content of galaxies selected via H I absorption offers a critical piece in the broader puzzle of galaxy evolution. In this paper, we present new ALMA observations of CO(2–1), CO(3–2), and CO(4–3) emission from galaxies at 0.3 < z < 1.2 observed in the ALMA Large Program MUSE-ALMA haloes survey (Cycle 10, PI: C. Péroux). These galaxies were initially selected through H I absorption along the line of sight of bright optical quasars (Weng et al. 2022). Notably, this study represents the first non-metallicity-biased survey of molecular gas in H I–selected galaxies, as the targets were selected based solely on neutral hydrogen absorption.
Our main findings are as follows:
-
We report a CO detection rate of 20% for our sample, which highlights the heterogeneous nature of H I–selected galaxies. Thanks to the depth of our observations, we have pushed detections of molecular gas by more than 1 dex below the MH2 limits reached in previous H I–selected studies. While some absorbers are associated with metal-rich, actively star-forming galaxies with substantial molecular reservoirs, others correspond to gas-rich but inefficient star-forming systems, potentially in early evolutionary stages. This diversity reflects the wide range of physical conditions accessible through absorption selection, from chemically enriched discs to diffuse CGM structures.
-
CO-detected galaxies exhibit gas-phase metallicities consistent with the mass–metallicity relation. However, their star formation rates and stellar masses span a broad range relative to emission-selected star-forming galaxies at similar redshifts. Systems with low molecular gas masses tend to align with the scaling relations of normal star-forming galaxies, whereas high-MH2 systems fall significantly below, which suggests distinct evolutionary pathways.
-
The inferred depletion timescales show a dual behaviour: low-MH2 galaxies exhibit depletion times consistent with main-sequence star-forming galaxies, while high-MH2 galaxies show longer timescales (∼1.5 dex above), pointing to suppressed star formation efficiency. This diversity indicates that absorption selection captures galaxies in both relatively evolved, star-forming phases and in earlier stages where gas reservoirs are not efficiently converted into stars. For the high-MH2 regime, this result is consistent with prior studies of absorption-selected galaxies (e.g., Neeleman et al. 2020; Kaur et al. 2022), which generally pre-selected metal-rich absorbers and thus preferentially traced gas-rich but inefficient systems. By contrast, the MUSE–ALMA Haloes survey extends this picture to lower-MH2 systems without metallicity preselection, and reveals that some absorber-selected galaxies follow the normal depletion times of main-sequence galaxies.
-
The properties of H I–selected systems (elevated gas fractions, a wide range of star formation efficiencies, and agreement with expected metallicities) stress their importance in the baryon cycle. H I–selected galaxies may be actively assembling gas from the intergalactic medium or interacting within group environments (e.g., Péroux et al. 2019; Hamanowicz et al. 2020), sometimes reaching a main-sequence-like behaviour, while in other cases remaining inefficient and offset from equilibrium conditions typical of star-forming galaxies.
H I–selected systems, often missed in emission-selected surveys, serve as crucial laboratories for studying the interplay between cold gas accretion, feedback, and star formation regulation. By combining absorption-line selection with molecular gas observations, we can access lower-luminosity, lower-SFR systems and build a more complete picture of the processes that shape galaxy evolution.
Interpreting the stringent CO non-detections afforded by these deep data remains challenging. It is unclear whether they result from genuinely low molecular content, low excitation conditions, or suppressed CO emission due to low metallicity. To disentangle these scenarios, it is essential to explore alternative tracers such as neutral carbon ([C I]) and dust continuum, which are less sensitive to metallicity and excitation than CO. Such complementary observations will help refine our understanding of the molecular gas content in diffuse, metal-poor, or quiescent systems.
Acknowledgments
This research was supported by the International Space Science Institute (ISSI) in Bern, through ISSI International Team project #564 (The Cosmic Baryon Cycle from Space). This paper makes use of the following ALMA data: ADS/JAO.ALMA#2023.1.00127.L ALMA is a partnership of ESO (representing its member states), NSF (USA) and NINS (Japan), together with NRC (Canada), MOST and ASIAA (Taiwan), and KASI (Republic of Korea), in cooperation with the Republic of Chile. The Joint ALMA Observatory is operated by ESO, AUI/NRAO and NAOJ. N.M.F.S., C.B., J.C. acknowledge funding by the European Union (ERC Advanced Grant GALPHYS, 101055023). Views and opinions expressed are, however, those of the author(s) only and do not necessarily reflect those of the European Union or the European Research Council. Neither the European Union nor the granting authority can be held responsible for them. R.A. acknowledges funding from the European Research Council (ERC) under the European Union’s Horizon 2020 research and innovation programme (grant agreement 101020943, SPECMAP-CGM).
References
- Accurso, G., Saintonge, A., Catinella, B., et al. 2017, MNRAS, 470, 4750 [NASA ADS] [Google Scholar]
- Adams, E. A. K., & van Leeuwen, J. 2019, Nat. Astron., 3, 188 [Google Scholar]
- Allison, J. R., Sadler, E. M., Bellstedt, S., et al. 2020, MNRAS, 494, 3627 [Google Scholar]
- Arnouts, S., Cristiani, S., Moscardini, L., et al. 1999, MNRAS, 310, 540 [Google Scholar]
- Augustin, R., Péroux, C., Karki, A., et al. 2024, MNRAS, 528, 6159 [Google Scholar]
- Bacon, R., Accardo, M., Adjali, L., et al. 2010, Proc. SPIE, 7735, 773508 [Google Scholar]
- Bera, A., Kanekar, N., Chengalur, J. N., & Bagla, J. S. 2019, ApJ, 882, L7 [NASA ADS] [CrossRef] [Google Scholar]
- Bigiel, F., Leroy, A., Walter, F., et al. 2008, AJ, 136, 2846 [NASA ADS] [CrossRef] [Google Scholar]
- Blyth, S. L., Baker, A. J., Holwerda, B. W., et al. 2016, Proceedings of MeerKAT Science: On the Pathway to the SKA [Google Scholar]
- Boettcher, E., Chen, H.-W., Zahedy, F. S., et al. 2021, ApJ, 913, 18 [Google Scholar]
- Bogdán, Á., Forman, W. R., Vogelsberger, M., et al. 2013, ApJ, 772, 97 [CrossRef] [Google Scholar]
- Bolatto, A. D., Wolfire, M., & Leroy, A. K. 2013, AARA&A, 51, 207 [NASA ADS] [CrossRef] [Google Scholar]
- Bollo, V., Zwaan, M., Péroux, C., et al. 2024, A&A, 690, A258 [NASA ADS] [CrossRef] [EDP Sciences] [Google Scholar]
- Bollo, V., Péroux, C., Zwaan, M., et al. 2025, A&A, 695, A163 [NASA ADS] [CrossRef] [EDP Sciences] [Google Scholar]
- Bouché, N., Dekel, A., Genzel, R., et al. 2010, ApJ, 718, 1001 [Google Scholar]
- Bouché, N., Finley, H., Schroetter, I., et al. 2016, ApJ, 820, 121 [Google Scholar]
- Bruzual, G., & Charlot, S. 2003, MNRAS, 344, 1000 [NASA ADS] [CrossRef] [Google Scholar]
- Calzetti, D., Kinney, A. L., & Storchi-Bergmann, T. 1994, ApJ, 429, 582 [Google Scholar]
- Carilli, C. L., & Walter, F. 2013, ARA&A, 51, 105 [NASA ADS] [CrossRef] [Google Scholar]
- Catinella, B., Saintonge, A., Janowiecki, S., et al. 2018, MNRAS, 476, 875 [NASA ADS] [CrossRef] [Google Scholar]
- Chabrier, G. 2003, PASP, 115, 763 [Google Scholar]
- Chowdhury, A., Kanekar, N., Chengalur, J. N., Sethi, S., & Dwarakanath, K. S. 2020, Nat Astron, 586, 369 [Google Scholar]
- Cooper, T. J., Rudie, G. C., Chen, H.-W., et al. 2021, MNRAS, 508, 4359 [Google Scholar]
- Curti, M., Cresci, G., Mannucci, F., et al. 2017, MNRAS, 465, 1384 [Google Scholar]
- Curti, M., Mannucci, F., Cresci, G., & Maiolino, R. 2020, MNRAS, 491, 944 [Google Scholar]
- Deka, P.P., Gupta, N., Jagannathan, P., et al. 2023, The MeerKAT Absorption Line Survey (MALS) Data Release I: Stokes I Image Catalogs at 1–1.4 GHz [Google Scholar]
- Dessauges-Zavadsky, M., Calura, F., Prochaska, J. X., D’Odorico, S., & Matteucci, F. 2007, A&A, 470, 431 [NASA ADS] [CrossRef] [EDP Sciences] [Google Scholar]
- Diemer, B., Stevens, A. R. H., Lagos, C. d. P., et al. 2019, MNRAS, 487, 1529 [Google Scholar]
- Dutta, R., Fumagalli, M., Fossati, M., et al. 2020, MNRAS, 499, 5022 [CrossRef] [Google Scholar]
- Dutta, S., Muzahid, S., Schaye, J., et al. 2024, MUSEQuBES: Mapping the Distribution of Neutral Hydrogen around Low-Redshift Galaxies [Google Scholar]
- Dutta, S., Muzahid, S., Schaye, J., et al. 2025, ApJ, 980, 264 [Google Scholar]
- Erb, D. K., Steidel, C. C., Shapley, A. E., et al. 2006, ApJ, 647, 128 [NASA ADS] [CrossRef] [Google Scholar]
- Faucher-Giguère, C.-A., & Oh, S. P. 2023, ARA&A, 61, 131 [CrossRef] [Google Scholar]
- Fernández, X., Gim, H. B., van Gorkom, J. H., et al. 2016, ApJ, 824, L1 [Google Scholar]
- Fixsen, D. J., Bennett, C. L., & Mather, J. C. 1999, ApJ, 526, 207 [Google Scholar]
- Forbes, J. C., Krumholz, M. R., Burkert, A., & Dekel, A. 2014, MNRAS, 443, 168 [NASA ADS] [CrossRef] [Google Scholar]
- Fossati, M., Fumagalli, M., Lofthouse, E. K., et al. 2021, MNRAS, 503, 3044 [NASA ADS] [CrossRef] [Google Scholar]
- Frank, S., Rasera, Y., Vibert, D., et al. 2012, MNRAS, 420, 1731 [Google Scholar]
- Fynbo, J. P. U., Heintz, K. E., Neeleman, M., et al. 2018, MNRAS, 479, 2126 [NASA ADS] [CrossRef] [Google Scholar]
- Genzel, R., Tacconi, L. J., Combes, F., et al. 2012, ApJ, 746, 69 [Google Scholar]
- Genzel, R., Tacconi, L. J., Lutz, D., et al. 2015, ApJ, 800, 20 [Google Scholar]
- Glover, S. C. O., & Mac Low, M.-M. 2007, ApJ, 659, 1317 [NASA ADS] [CrossRef] [Google Scholar]
- Glowacki, M., Collier, J. D., Kazemi-Moridani, A., et al. 2022, ApJ, 931, L7 [NASA ADS] [CrossRef] [Google Scholar]
- Hamanowicz, A., Péroux, C., Zwaan, M. A., et al. 2020, MNRAS, 492, 2347 [CrossRef] [Google Scholar]
- Haynes, M. P., & Giovanelli, R. 1984, AJ, 89, 758 [Google Scholar]
- Hotan, A. W., Bunton, J. D., Chippendale, A. P., et al. 2021, PASA, 38, e009 [NASA ADS] [CrossRef] [Google Scholar]
- Ilbert, O., Arnouts, S., McCracken, H. J., et al. 2006, A&A, 457, 841 [NASA ADS] [CrossRef] [EDP Sciences] [Google Scholar]
- Inoue, S., Yoshida, N., & Yajima, H. 2020, MNRAS, 498, 5960 [NASA ADS] [CrossRef] [Google Scholar]
- Kacprzak, G. G., Churchill, C. W., Evans, J. L., Murphy, M. T., & Steidel, C. C. 2011, MNRAS, 416, 3118 [NASA ADS] [CrossRef] [Google Scholar]
- Kanekar, N., Prochaska, J. X., Smette, A., et al. 2014, MNRAS, 438, 2131 [NASA ADS] [CrossRef] [Google Scholar]
- Kanekar, N., Prochaska, J. X., Christensen, L., et al. 2018, ApJ, 856, L23 [NASA ADS] [CrossRef] [Google Scholar]
- Kanekar, N., Prochaska, J. X., Neeleman, M., et al. 2020, ApJ, 901, L5 [CrossRef] [Google Scholar]
- Karki, A., Kulkarni, V. P., Weng, S., et al. 2023, MNRAS, 524, 5524 [Google Scholar]
- Kaur, B., Kanekar, N., Rafelski, M., et al. 2021, ApJ, 921, 68 [NASA ADS] [CrossRef] [Google Scholar]
- Kaur, B., Kanekar, N., Revalski, M., et al. 2022, ApJ, 934, 87 [CrossRef] [Google Scholar]
- Kaur, B., Kanekar, N., Neeleman, M., et al. 2024, ApJ, 971, L33 [NASA ADS] [CrossRef] [Google Scholar]
- Kaur, B., Kanekar, N., Neeleman, M., et al. 2025, ApJ, 982, L26 [Google Scholar]
- Keating, L. C., Richings, A. J., Murray, N., et al. 2020, MNRAS, 499, 837 [NASA ADS] [CrossRef] [Google Scholar]
- Kennicutt, R. C., & Evans, N. J. 2012, ARA&A, 50, 531 [NASA ADS] [CrossRef] [Google Scholar]
- Klimenko, V. V., Kulkarni, V., Wake, D. A., et al. 2023, The Baryonic Content of Galaxies Mapped by MaNGA and the Gas Around Them [Google Scholar]
- Klitsch, A., Péroux, C., Zwaan, M. A., et al. 2018, MNRAS, 475, 492 [NASA ADS] [CrossRef] [Google Scholar]
- Klitsch, A., Zwaan, M. A., Péroux, C., et al. 2019, MNRAS, 482, L65 [NASA ADS] [CrossRef] [Google Scholar]
- Klitsch, A., Péroux, C., Zwaan, M. A., et al. 2021, MNRAS, 506, 514 [Google Scholar]
- Klitsch, A., Christensen, L., Valentino, F., et al. 2022, MNRAS, 514, 2346 [Google Scholar]
- Koribalski, B. S., Duchesne, S. W., Lenc, E., et al. 2024, MNRAS, 533, 608 [NASA ADS] [CrossRef] [Google Scholar]
- Krumholz, M. R., McKee, C. F., & Tumlinson, J. 2009, ApJ, 693, 216 [NASA ADS] [CrossRef] [Google Scholar]
- Kulkarni, V. P., Hill, J. M., Schneider, G., et al. 2000, ApJ, 536, 36 [Google Scholar]
- Kulkarni, V. P., Fall, S. M., Lauroesch, J. T., et al. 2005, ApJ, 618, 68 [Google Scholar]
- Kulkarni, V. P., Som, D., Morrison, S., et al. 2015, ApJ, 815, 24 [NASA ADS] [CrossRef] [Google Scholar]
- Kulkarni, V. P., Bowen, D. V., Straka, L. A., et al. 2022, ApJ, 929, 150 [Google Scholar]
- Langan, I., Zabl, J., Bouché, N. F., et al. 2023, MNRAS, 521, 546 [NASA ADS] [CrossRef] [Google Scholar]
- Lee, B., Wang, J., Chung, A., et al. 2022, ApJS, 262, 31 [NASA ADS] [CrossRef] [Google Scholar]
- Lehner, N., Howk, J. C., Tripp, T. M., et al. 2013, ApJ, 770, 138 [NASA ADS] [CrossRef] [Google Scholar]
- Leroy, A. K., Walter, F., Brinks, E., et al. 2008, AJ, 136, 2782 [Google Scholar]
- Li, C. 2013, IAU Symp., 292, 149 [Google Scholar]
- Li, Q., Narayanan, D., Davè, R., & Krumholz, M. R. 2018, ApJ, 869, 73 [Google Scholar]
- Lilly, S. J., Carollo, C. M., Pipino, A., Renzini, A., & Peng, Y. 2013, ApJ, 772, 119 [NASA ADS] [CrossRef] [Google Scholar]
- Lin, L., Zhang, Z.-Y., Wang, J., et al. 2025, Nat. Astron., 1 [Google Scholar]
- Lofthouse, E. K., Fumagalli, M., Fossati, M., et al. 2020, MNRAS, 491, 2057 [NASA ADS] [CrossRef] [Google Scholar]
- Lupi, A., Bovino, S., Capelo, P. R., Volonteri, M., & Silk, J. 2018, MNRAS, 474, 2884 [NASA ADS] [CrossRef] [Google Scholar]
- Lupi, A., Pallottini, A., Ferrara, A., et al. 2020, MNRAS, 496, 5160 [Google Scholar]
- Madden, S. C., Cormier, D., Hony, S., et al. 2020, A&A, 643, A141 [NASA ADS] [CrossRef] [EDP Sciences] [Google Scholar]
- Maddox, N., Frank, B. S., Ponomareva, A. A., et al. 2021, A&A, 646, A35 [NASA ADS] [CrossRef] [EDP Sciences] [Google Scholar]
- Maio, U., Péroux, C., & Ciardi, B. 2022, A&A, 657, A47 [NASA ADS] [CrossRef] [EDP Sciences] [Google Scholar]
- Maiolino, R., Nagao, T., Grazian, A., et al. 2008, A&A, 488, 463 [NASA ADS] [CrossRef] [EDP Sciences] [Google Scholar]
- Martin, D. C., O’Sullivan, D., Matuszewski, M., et al. 2019, Nat. Astron., 3, 822 [NASA ADS] [CrossRef] [Google Scholar]
- Masui, K. W., Switzer, E. R., Banavar, N., et al. 2013, ApJ, 763, L20 [Google Scholar]
- McMullin, J. P., Waters, B., Schiebel, D., Young, W., & Golap, K. 2007, ASP Conf. Ser., 376, 127 [Google Scholar]
- Merloni, A., Predehl, P., Becker, W., et al. 2012, eROSITA Science Book: Mapping the Structure of the Energetic Universe [Google Scholar]
- Messias, H., Guerrero, A., Nagar, N., et al. 2024, MNRAS, 533, 3937 [Google Scholar]
- Møller, P., Christensen, L., Zwaan, M. A., et al. 2018, MNRAS, 474, 4039 [CrossRef] [Google Scholar]
- Muzahid, S., Srianand, R., & Charlton, J. 2015, MNRAS, 448, 2840 [Google Scholar]
- Muzahid, S., Schaye, J., Marino, R. A., et al. 2020, MNRAS, 496, 1013 [Google Scholar]
- Naab, T., & Ostriker, J. P. 2017, ARA&A, 55, 59 [Google Scholar]
- Neeleman, M., Prochaska, J. X., Zwaan, M. A., et al. 2016, ApJ, 820, L39 [NASA ADS] [CrossRef] [Google Scholar]
- Neeleman, M., Kanekar, N., Prochaska, J. X., et al. 2017, Science, 355, 1285 [NASA ADS] [CrossRef] [Google Scholar]
- Neeleman, M., Kanekar, N., Prochaska, J. X., et al. 2018, ApJ, 856, L12 [NASA ADS] [CrossRef] [Google Scholar]
- Neeleman, M., Kanekar, N., Xavier Prochaska, J., Rafelski, M. A., & Carilli, C. L. 2019, ApJ, 870, L19 [NASA ADS] [CrossRef] [Google Scholar]
- Neeleman, M., Prochaska, J. X., Kanekar, N., & Rafelski, M. 2020, Nat. Astron., 581, 269 [Google Scholar]
- Neeleman, M., Kanekar, N., Prochaska, J. X., Rafelski, M. A., & Kahinga, L. A. 2025, ApJ, 983, 26 [Google Scholar]
- Nelson, D., Sharma, P., Pillepich, A., et al. 2020, MNRAS, 498, 2391 [NASA ADS] [CrossRef] [Google Scholar]
- Nielsen, N. M., Kacprzak, G. G., Pointon, S. K., et al. 2020, ApJ, 904, 164 [NASA ADS] [CrossRef] [Google Scholar]
- Olsen, K. P., Burkhart, B., Mac Low, M.-M., et al. 2021, ApJ, 922, 88 [NASA ADS] [CrossRef] [Google Scholar]
- Oppenheimer, B. D., & Davé, R. 2008, MNRAS, 387, 577 [NASA ADS] [CrossRef] [Google Scholar]
- Oppenheimer, B. D., Babul, A., Bahé, Y., Butsky, I. S., & McCarthy, I. G. 2021, Universe, 7, 209 [NASA ADS] [CrossRef] [Google Scholar]
- Pallottini, A., Ferrara, A., Gallerani, S., et al. 2022, MNRAS, 513, 5621 [NASA ADS] [Google Scholar]
- Péroux, C., & Howk, J. C. 2020, ARA&A, 58, 363 [CrossRef] [Google Scholar]
- Peroux, C., & Nelson, D. 2024, The Multi-Scale Multi-Phase Circumgalactic Medium: Observed and Simulated [Google Scholar]
- Péroux, C., McMahon, R. G., Storrie-Lombardi, L. J., & Irwin, M. J. 2003, MNRAS, 346, 1103 [Google Scholar]
- Péroux, C., Meiring, J. D., Kulkarni, V. P., et al. 2006, MNRAS, 372, 369 [Google Scholar]
- Péroux, C., Quiret, S., Rahmani, H., et al. 2016, MNRAS, 457, 903 [Google Scholar]
- Péroux, C., Rahmani, H., Quiret, S., et al. 2017, MNRAS, 464, 2053 [CrossRef] [Google Scholar]
- Péroux, C., Zwaan, M. A., Klitsch, A., et al. 2019, MNRAS, 485, 1595 [CrossRef] [Google Scholar]
- Péroux, C., Weng, S., Karki, A., et al. 2022, MNRAS, 516, 5618 [Google Scholar]
- Pettini, M., & Pagel, B. E. J. 2004, MNRAS, 348, L59 [NASA ADS] [CrossRef] [Google Scholar]
- Pettini, M., Ellison, S. L., Steidel, C. C., & Bowen, D. V. 1999, ApJ, 510, 576 [NASA ADS] [CrossRef] [Google Scholar]
- Popping, G., Narayanan, D., Somerville, R. S., Faisst, A. L., & Krumholz, M. R. 2019, MNRAS, 482, 4906 [Google Scholar]
- Prochaska, J. X., & Wolfe, A. M. 1998, ApJ, 507, 113 [Google Scholar]
- Prochaska, J. X., Werk, J. K., Worseck, G., et al. 2017, ApJ, 837, 169 [CrossRef] [Google Scholar]
- Quiret, S., Péroux, C., Zafar, T., et al. 2016, MNRAS, 458, 4074 [NASA ADS] [CrossRef] [Google Scholar]
- Rafelski, M., Wolfe, A. M., Prochaska, J. X., Neeleman, M., & Mendez, A. J. 2012, ApJ, 755, 89 [NASA ADS] [CrossRef] [Google Scholar]
- Rahmani, H., Péroux, C., Augustin, R., et al. 2018a, MNRAS, 474, 254 [NASA ADS] [CrossRef] [Google Scholar]
- Rahmani, H., Péroux, C., Schroetter, I., et al. 2018b, MNRAS, 480, 5046 [NASA ADS] [Google Scholar]
- Rhee, J., Lah, P., Briggs, F. H., et al. 2018, MNRAS, 473, 1879 [NASA ADS] [CrossRef] [Google Scholar]
- Richings, A. J., & Schaye, J. 2016, MNRAS, 458, 270 [NASA ADS] [CrossRef] [Google Scholar]
- Richings, A. J., Faucher-Giguere, C.-A., Gurvich, A. B., Schaye, J., & Hayward, C. C. 2022, MNRAS, 517, 1557 [NASA ADS] [CrossRef] [Google Scholar]
- Richter, P., Nuza, S. E., Fox, A. J., et al. 2017, A&A, 607, A48 [NASA ADS] [CrossRef] [EDP Sciences] [Google Scholar]
- Saintonge, A., & Catinella, B. 2022, ARA&A, 60, 319 [NASA ADS] [CrossRef] [Google Scholar]
- Saintonge, A., Catinella, B., Tacconi, L. J., et al. 2017, ApJS, 233, 22 [Google Scholar]
- Schroetter, I., Bouché, N., Wendt, M., et al. 2016, ApJ, 833, 39 [NASA ADS] [CrossRef] [Google Scholar]
- Schruba, A., Leroy, A. K., Walter, F., et al. 2012, AJ, 143, 138 [NASA ADS] [CrossRef] [Google Scholar]
- Serra, P., Westmeier, T., Giese, N., et al. 2015, MNRAS, 448, 1922 [Google Scholar]
- Sharma, S. S., Roy, J., Kudale, S., et al. 2023, ApJ, 947, 88 [Google Scholar]
- Smit, R., Bouwens, R. J., Labbé, I., et al. 2014, ApJ, 784, 58 [NASA ADS] [CrossRef] [Google Scholar]
- Solomon, P. M., Downes, D., Radford, S. J. E., & Barrett, J. W. 1997, ApJ, 478, 144 [NASA ADS] [CrossRef] [Google Scholar]
- Stern, J., Hennawi, J. F., Prochaska, J. X., & Werk, J. K. 2016, ApJ, 830, 87 [NASA ADS] [CrossRef] [Google Scholar]
- Sternberg, A., Le Petit, F., Roueff, E., & Le Bourlot, J. 2014, ApJ, 790, 10 [CrossRef] [Google Scholar]
- Strickland, D. K., Heckman, T. M., Colbert, E. J. M., Hoopes, C. G., & Weaver, K. A. 2004, ApJ, 606, 829 [NASA ADS] [CrossRef] [Google Scholar]
- Su, R., Gu, M., Curran, S. J., et al. 2023, ApJ, 956, L28 [Google Scholar]
- Szakacs, R., Péroux, C., Zwaan, M., et al. 2021, MNRAS, 505, 4746 [NASA ADS] [CrossRef] [Google Scholar]
- Tacchella, S., Dekel, A., Carollo, C. M., et al. 2016, MNRAS, 458, 242 [NASA ADS] [CrossRef] [Google Scholar]
- Tacconi, L. J., Genzel, R., Neri, R., et al. 2010, Nature, 463, 781 [Google Scholar]
- Tacconi, L. J., Genzel, R., Saintonge, A., et al. 2018, ApJ, 853, 179 [Google Scholar]
- Tacconi, L. J., Genzel, R., & Sternberg, A. 2020, ARA&A, 58, 157 [NASA ADS] [CrossRef] [Google Scholar]
- Thompson, O. A., Richings, A. J., Gibson, B. K., et al. 2024, MNRAS, 532, 1948 [Google Scholar]
- Tumlinson, J., Peeples, M. S., & Werk, J. K. 2017, ARA&A, 55, 389 [Google Scholar]
- van de Voort, F., Springel, V., Mandelker, N., van den Bosch, F. C., & Pakmor, R. 2019, MNRAS, 482, L85 [NASA ADS] [CrossRef] [Google Scholar]
- Walter, F., Brinks, E., de Blok, W. J. G., et al. 2008, AJ, 136, 2563 [Google Scholar]
- Walter, F., Carilli, C., Neeleman, M., et al. 2020, ApJ, 902, 111 [Google Scholar]
- Wang, J., Yang, D., Oh, S. H., et al. 2023, ApJ, 944, 102 [NASA ADS] [CrossRef] [Google Scholar]
- Wang, J., Yang, D., Lin, X., et al. 2025, ApJ, 980, 25 [Google Scholar]
- Weiß, A., Walter, F., & Scoville, N. Z. 2005, A&A, 438, 533 [NASA ADS] [CrossRef] [EDP Sciences] [Google Scholar]
- Weng, S., Péroux, C., Karki, A., et al. 2022, MUSE-ALMA Haloes VIII: Statistical Study of Circumgalactic Medium Gas [Google Scholar]
- Weng, S., Péroux, C., Karki, A., et al. 2023a, MNRAS, 523, 676 [NASA ADS] [CrossRef] [Google Scholar]
- Weng, S., Péroux, C., Karki, A., et al. 2023b, MNRAS, 519, 931 [Google Scholar]
- Weng, S., Péroux, C., Ramesh, R., et al. 2024, MNRAS, 527, 3494 [Google Scholar]
- Werk, J. K., Prochaska, J. X., Tumlinson, J., et al. 2014, ApJ, 792, 8 [NASA ADS] [CrossRef] [Google Scholar]
- Westmeier, T., Kitaeff, S., Pallot, D., et al. 2021, MNRAS, 506, 3962 [NASA ADS] [CrossRef] [Google Scholar]
- Wolfe, A. M., Gawiser, E., & Prochaska, J. X. 2005, ARA&A, 43, 861 [NASA ADS] [CrossRef] [Google Scholar]
- Wolfire, M. G., Hollenbach, D., McKee, C. F., Tielens, A. G. G. M., & Bakes, E. L. O. 1995, ApJ, 443, 152 [Google Scholar]
- Wolfire, M. G., Hollenbach, D., & McKee, C. F. 2010, ApJ, 716, 1191 [Google Scholar]
- Wuyts, E., Kurk, J., Förster Schreiber, N. M., et al. 2014, ApJ, 789, L40 [NASA ADS] [CrossRef] [Google Scholar]
- Xi, H., Peng, B., Staveley-Smith, L., et al. 2024, ApJ, 966, L36 [NASA ADS] [Google Scholar]
- Yoon, H., Sadler, E. M., Mahony, E. K., et al. 2024, The First Large Absorption Survey in HI (FLASH): II. Pilot Survey Data Release and First Results [Google Scholar]
- York, D. G., Dopita, M., Green, R., & Bechtold, J. 1986, ApJ, 311, 610 [Google Scholar]
- Yu, N., Ho, L. C., & Wang, J. 2022, ApJ, 930, 85 [Google Scholar]
- Yu, N.-P., Zhu, M., Xu, J.-L., et al. 2024, MNRAS, 532, 1744 [Google Scholar]
- Zahedy, F. S., Chen, H.-W., Cooper, T. M., et al. 2021, MNRAS, 506, 877 [NASA ADS] [CrossRef] [Google Scholar]
- Zahid, H. J., Kashino, D., Silverman, J. D., et al. 2014, ApJ, 792, 75 [NASA ADS] [CrossRef] [Google Scholar]
- Zanella, A., Daddi, E., Magdis, G., et al. 2018, MNRAS, 481, 1976 [Google Scholar]
- Zhang, Y., Comparat, J., Ponti, G., et al. 2025, A&A, 693, A197 [NASA ADS] [CrossRef] [EDP Sciences] [Google Scholar]
- Zwaan, M. A., Meyer, M. J., Staveley-Smith, L., & Webster, R. L. 2005, MNRAS, 359, L30 [NASA ADS] [CrossRef] [Google Scholar]
- Zwaan, M., Ivison, R., Peroux, C., et al. 2022, ALMACAL: Surveying the Universe with ALMA Calibrator Observations, https://doi.eso.org/10.18727/0722-6691/5256 [Google Scholar]
Appendix A: Detections
Detections. Measured properties of the new nine detected sources from the MUSE-ALMA Haloes ALMA Large Program.
All Tables
Detections. Measured properties of the new nine detected sources from the MUSE-ALMA Haloes ALMA Large Program.
All Figures
|
Fig. 1. Distribution of CO detections (blue) and non-CO detections (light blue) on galaxies as a function of redshift (left) and stellar mass (middle). The right panel is plotted as a function of metallicity corresponding to multiple galaxies associated with the absorbers (Halley et al., in prep). This figure represents the MUSE-ALMA Haloes survey, including all the sources from the new ALMA Large Program and previous ALMA data (see Section 2.2). The middle and right panels have fewer numbers because only those with reliable M★ and [M/H] determinations are included. The median values for the detections are 0.6, 9.66 and −1.23 for the redshift, stellar mass and absorption metallicity, while the non-detections have median values of 0.5, 9.16, and −1.84. Overall, we report no clear correlation between the detection rate and any of these properties, which suggests that the detection of CO emission may be governed by a combination of global galaxy properties, rather than just one property alone. |
| In the text | |
|
Fig. 2. CO detections and spectral profiles of the nine new detected sources. Left panels show the moment zero maps with the ±3, ±4, and ±5σ level contours, while the right panels display the extracted CO spectra. The grey shaded regions around each spectrum represent the ±1σ RMS noise level estimate from the individual data cubes, and the blue shaded region indicates the velocity range used to create the moment maps. The final row, right figure, presents the rest-frame stacked spectrum of non-detections with ±1σ and ±2σ levels. A summary of the integrated CO fluxes and associated uncertainties for all detected sources is provided in Table A.1 |
| In the text | |
|
Fig. 3. Different αCO models across varying metallicites. In this work, we adopt the model proposed by Genzel et al. (2015), shown in the blue points, which corresponds to the geometric mean of the prescriptions of Bolatto et al. (2013) and Genzel et al. (2012), as indicated in Eq. (3). As a reference, we also include the model proposed by Accurso et al. (2017), which would lead to higher values for αCO for the galaxies in our sample. To prevent extrapolation into poorly constrained regions of parameter space, we impose an upper limit on αCO, set to the lowest emission metallicity measured in our sample, which leads to an αCO ∼ 15. |
| In the text | |
|
Fig. 4. Left: Molecular gas mass (MH2) as a function of H I column density (NHI). Blue circles represent our sample in comparison with previous studies on H I-absorption selected systems from Kanekar et al. (2018) and Klitsch et al. (2021), shown in grey. Right: NHI and impact parameter, colour-coded by the molecular gas masses. In this plot, we include all impact parameters for the sources in our sample, rather than limiting to the smallest b as done in previous studies (e.g. Péroux et al. 2016; Hamanowicz et al. 2020; Weng et al. 2022). The circles represent CO detections, and the triangle represents non-CO detections. We also include the median radial profiles for the neutral hydrogen column density from the simulations by van de Voort et al. (2019) and Nelson et al. (2020) in the dashed and dotted lines, respectively. We report no clear correlation between the column density and impact parameter for different molecular gas masses. |
| In the text | |
|
Fig. 5. Left: Star formation rate as a function of molecular gas mass (MH2). Right: Stellar mass (M★) as a function of molecular gas mass (MH2). Our sample is shown in blue circles, and the blue arrows represent a 3σ upper limit. The result from the stacked spectrum described in Sect. 3.2 is shown by the blue star. We also include the mean dust correction for SFR depicted by a large blue arrow on the corner of the left panel. For comparison, we include data from the xCOLD GASS survey (Saintonge et al. 2017), which represents low-redshift galaxies, and the PHIBSS survey (Tacconi et al. 2018), in the redshift range z ∼ 0.3 − 1.2. The solid line represents the molecular gas main sequence scaling relation from Tacconi et al. (2018). We also included estimates from Kanekar et al. (2018) and Klitsch et al. (2021) in both panels, labelled as other H I–selected systems. Our sources with MH2/M⊙ ≲ 109.8 lie ∼0.3 dex above the expected SFR−MH2 relations for ‘normal star-forming galaxies’ at the same redshift range, while the systems with with MH2/M⊙ > 109.8 lie ∼1.5 dex below the relation. This trend suggests that H I–selected systems have a dual behaviour. Galaxies with low molecular gas masses form stars efficiently, following both the depletion timescales and the M★ − MH2 scaling relations of main-sequence galaxies. In contrast, galaxies with high molecular gas masses show inefficient star formation and fall below the expected stellar mass growth, likely because they are still actively accreting gas from the intergalactic medium or interacting within group environments. These systems appear not yet to have reached the equilibrium conditions characteristic of main-sequence galaxies. |
| In the text | |
|
Fig. 6. Left: Nebular emission metallicity, 12 + log(O/H) (Weng et al. 2023b), as a function of molecular gas mass (MH2) for our H I–selected galaxies. Blue circles indicate CO detections, and blue leftwards arrows show 3σ upper limits for CO non-detections. The result from the stacked spectrum described in Sect. 3.2 is shown by the blue star. The solid line indicates the mass-metallicity relation from Genzel et al. (2015) for the PHIBSS sample (Tacconi et al. 2018). A positive correlation emerges between metallicity and CO detectability, with CO-detected galaxies tending to occupy the higher-metallicity regime (log Z ≳ 8.5), as found previously in many studies (e.g., Bolatto et al. 2013). Right: Histogram of emission metallicities for all galaxies, with CO detections in blue and non-detections in light blue filled histogram. The dashed orange line indicates a metallicity log Z ∼ 8.5, which sets the higher and lower metallicity regimes discussed in Sect. 5. Although the distributions overlap significantly, a two-sample Kolmogorov-Smirnov test yields a p-value of 0.004, which indicates a statistically significant difference in the underlying metallicity distributions. This reinforces the interpretation that metallicity plays a key role in governing the observability of molecular gas in H I–selected systems. |
| In the text | |
|
Fig. 7. Molecular gas depletion time (tdep = MH2/SFR) as a function of redshift for our H I–selected sample (blue circles for high molecular gas systems and light-blue for low molecular gas mass systems), compares with literature scaling relations and emission-selected samples (Saintonge et al. 2017; Tacconi et al. 2018). The result from the stacked spectrum described in Sect. 3.2 is shown by the blue star. The solid red curve shows the empirically derived tdep evolution for main-sequence galaxies from Tacconi et al. (2018), the dotted line marks the Hubble time at each redshift, the thin solid line represents the stellar mass doubling time (t* = M★/SFR) from Tacconi et al. (2020), and the dashed purple line is from the cosmic depletion timescales derived from the ALMACAL survey (Bollo et al. 2025). H I–selected galaxies, both from our sample and from high-redshift literature sources (grey dots; Klitsch et al. 2021; Neeleman et al. 2018, 2020, 2025; Fynbo et al. 2018; Kanekar et al. 2020, 2018; Kaur et al. 2022, 2025), consistently lie above the main-sequence relation, which indicates lower star formation efficiencies. Several galaxies exhibit tdep approaching or exceeding the Hubble time, which suggests inefficient molecular gas consumption or suppressed star formation. |
| In the text | |
Current usage metrics show cumulative count of Article Views (full-text article views including HTML views, PDF and ePub downloads, according to the available data) and Abstracts Views on Vision4Press platform.
Data correspond to usage on the plateform after 2015. The current usage metrics is available 48-96 hours after online publication and is updated daily on week days.
Initial download of the metrics may take a while.