Fig. 2.
Download original image
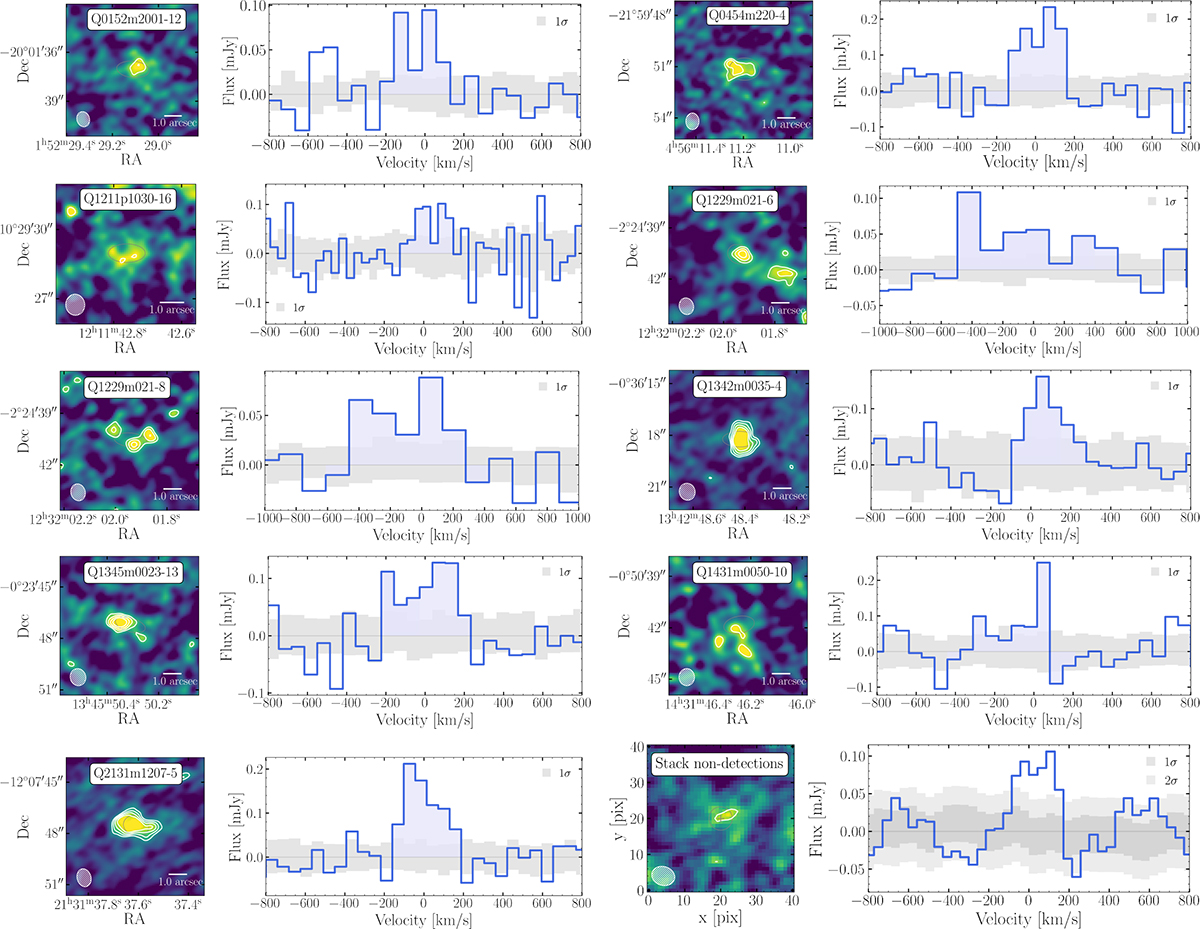
CO detections and spectral profiles of the nine new detected sources. Left panels show the moment zero maps with the ±3, ±4, and ±5σ level contours, while the right panels display the extracted CO spectra. The grey shaded regions around each spectrum represent the ±1σ RMS noise level estimate from the individual data cubes, and the blue shaded region indicates the velocity range used to create the moment maps. The final row, right figure, presents the rest-frame stacked spectrum of non-detections with ±1σ and ±2σ levels. A summary of the integrated CO fluxes and associated uncertainties for all detected sources is provided in Table A.1
Current usage metrics show cumulative count of Article Views (full-text article views including HTML views, PDF and ePub downloads, according to the available data) and Abstracts Views on Vision4Press platform.
Data correspond to usage on the plateform after 2015. The current usage metrics is available 48-96 hours after online publication and is updated daily on week days.
Initial download of the metrics may take a while.