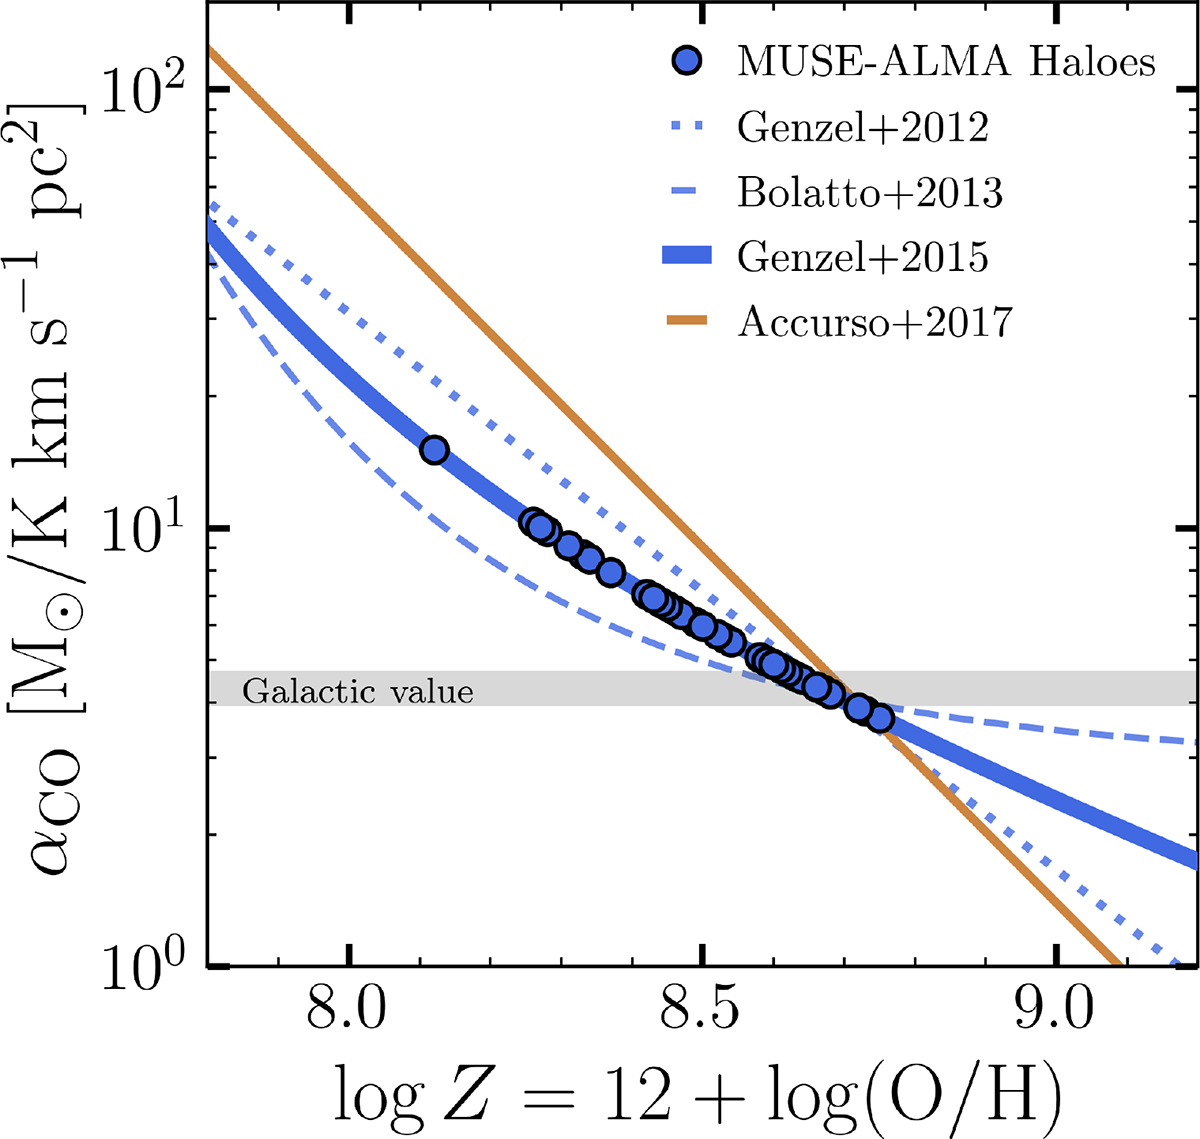
Fig. 3.
Download original image
Different αCO models across varying metallicites. In this work, we adopt the model proposed by Genzel et al. (2015), shown in the blue points, which corresponds to the geometric mean of the prescriptions of Bolatto et al. (2013) and Genzel et al. (2012), as indicated in Eq. (3). As a reference, we also include the model proposed by Accurso et al. (2017), which would lead to higher values for αCO for the galaxies in our sample. To prevent extrapolation into poorly constrained regions of parameter space, we impose an upper limit on αCO, set to the lowest emission metallicity measured in our sample, which leads to an αCO ∼ 15.
Current usage metrics show cumulative count of Article Views (full-text article views including HTML views, PDF and ePub downloads, according to the available data) and Abstracts Views on Vision4Press platform.
Data correspond to usage on the plateform after 2015. The current usage metrics is available 48-96 hours after online publication and is updated daily on week days.
Initial download of the metrics may take a while.