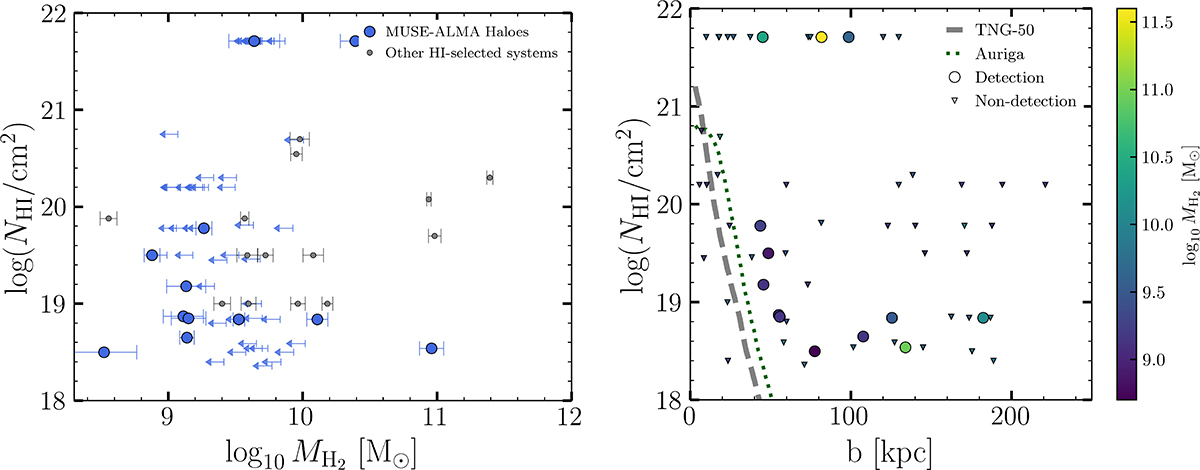
Fig. 4.
Download original image
Left: Molecular gas mass (MH2) as a function of H I column density (NHI). Blue circles represent our sample in comparison with previous studies on H I-absorption selected systems from Kanekar et al. (2018) and Klitsch et al. (2021), shown in grey. Right: NHI and impact parameter, colour-coded by the molecular gas masses. In this plot, we include all impact parameters for the sources in our sample, rather than limiting to the smallest b as done in previous studies (e.g. Péroux et al. 2016; Hamanowicz et al. 2020; Weng et al. 2022). The circles represent CO detections, and the triangle represents non-CO detections. We also include the median radial profiles for the neutral hydrogen column density from the simulations by van de Voort et al. (2019) and Nelson et al. (2020) in the dashed and dotted lines, respectively. We report no clear correlation between the column density and impact parameter for different molecular gas masses.
Current usage metrics show cumulative count of Article Views (full-text article views including HTML views, PDF and ePub downloads, according to the available data) and Abstracts Views on Vision4Press platform.
Data correspond to usage on the plateform after 2015. The current usage metrics is available 48-96 hours after online publication and is updated daily on week days.
Initial download of the metrics may take a while.