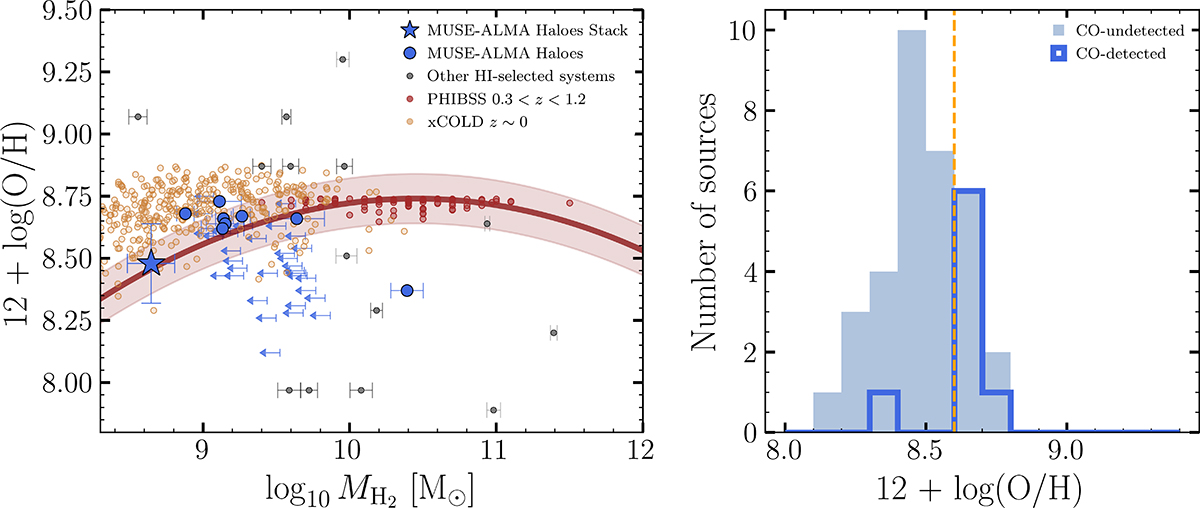
Fig. 6.
Download original image
Left: Nebular emission metallicity, 12 + log(O/H) (Weng et al. 2023b), as a function of molecular gas mass (MH2) for our H I–selected galaxies. Blue circles indicate CO detections, and blue leftwards arrows show 3σ upper limits for CO non-detections. The result from the stacked spectrum described in Sect. 3.2 is shown by the blue star. The solid line indicates the mass-metallicity relation from Genzel et al. (2015) for the PHIBSS sample (Tacconi et al. 2018). A positive correlation emerges between metallicity and CO detectability, with CO-detected galaxies tending to occupy the higher-metallicity regime (log Z ≳ 8.5), as found previously in many studies (e.g., Bolatto et al. 2013). Right: Histogram of emission metallicities for all galaxies, with CO detections in blue and non-detections in light blue filled histogram. The dashed orange line indicates a metallicity log Z ∼ 8.5, which sets the higher and lower metallicity regimes discussed in Sect. 5. Although the distributions overlap significantly, a two-sample Kolmogorov-Smirnov test yields a p-value of 0.004, which indicates a statistically significant difference in the underlying metallicity distributions. This reinforces the interpretation that metallicity plays a key role in governing the observability of molecular gas in H I–selected systems.
Current usage metrics show cumulative count of Article Views (full-text article views including HTML views, PDF and ePub downloads, according to the available data) and Abstracts Views on Vision4Press platform.
Data correspond to usage on the plateform after 2015. The current usage metrics is available 48-96 hours after online publication and is updated daily on week days.
Initial download of the metrics may take a while.