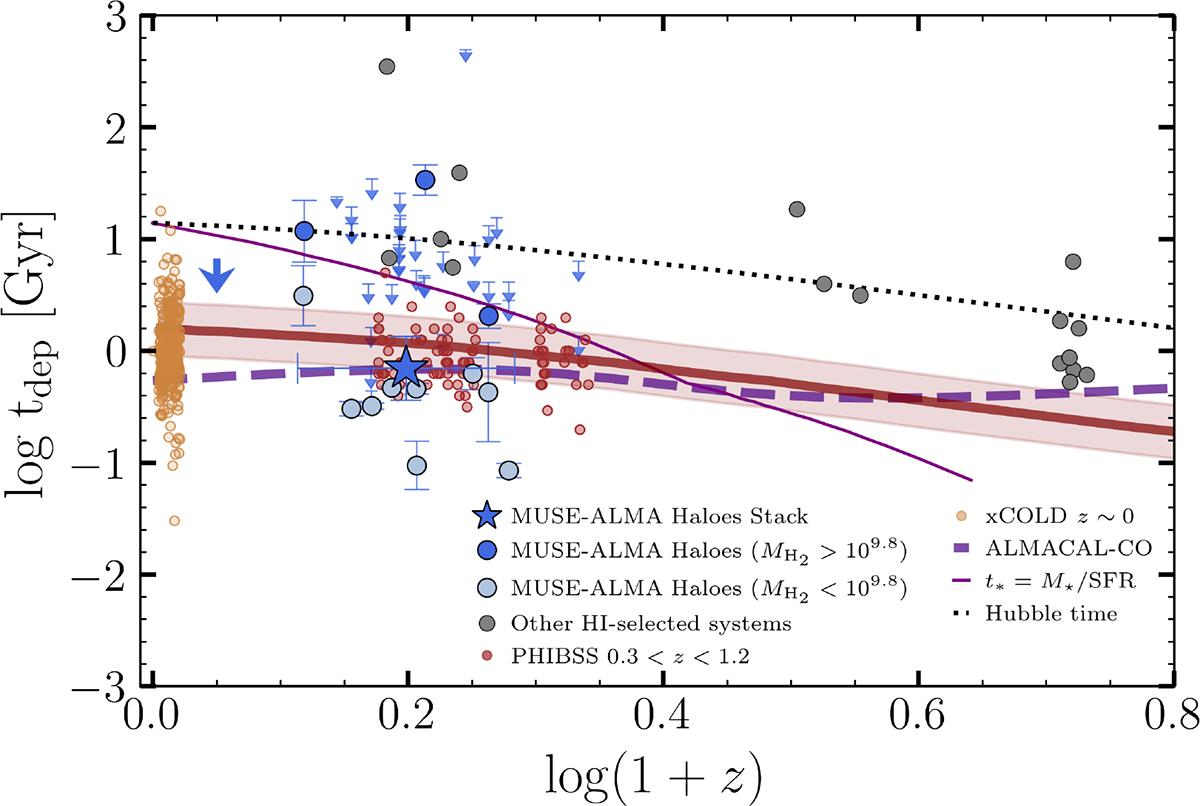
Fig. 7.
Download original image
Molecular gas depletion time (tdep = MH2/SFR) as a function of redshift for our H I–selected sample (blue circles for high molecular gas systems and light-blue for low molecular gas mass systems), compares with literature scaling relations and emission-selected samples (Saintonge et al. 2017; Tacconi et al. 2018). The result from the stacked spectrum described in Sect. 3.2 is shown by the blue star. The solid red curve shows the empirically derived tdep evolution for main-sequence galaxies from Tacconi et al. (2018), the dotted line marks the Hubble time at each redshift, the thin solid line represents the stellar mass doubling time (t* = M★/SFR) from Tacconi et al. (2020), and the dashed purple line is from the cosmic depletion timescales derived from the ALMACAL survey (Bollo et al. 2025). H I–selected galaxies, both from our sample and from high-redshift literature sources (grey dots; Klitsch et al. 2021; Neeleman et al. 2018, 2020, 2025; Fynbo et al. 2018; Kanekar et al. 2020, 2018; Kaur et al. 2022, 2025), consistently lie above the main-sequence relation, which indicates lower star formation efficiencies. Several galaxies exhibit tdep approaching or exceeding the Hubble time, which suggests inefficient molecular gas consumption or suppressed star formation.
Current usage metrics show cumulative count of Article Views (full-text article views including HTML views, PDF and ePub downloads, according to the available data) and Abstracts Views on Vision4Press platform.
Data correspond to usage on the plateform after 2015. The current usage metrics is available 48-96 hours after online publication and is updated daily on week days.
Initial download of the metrics may take a while.