Open Access
Fig. 10.
Download original image
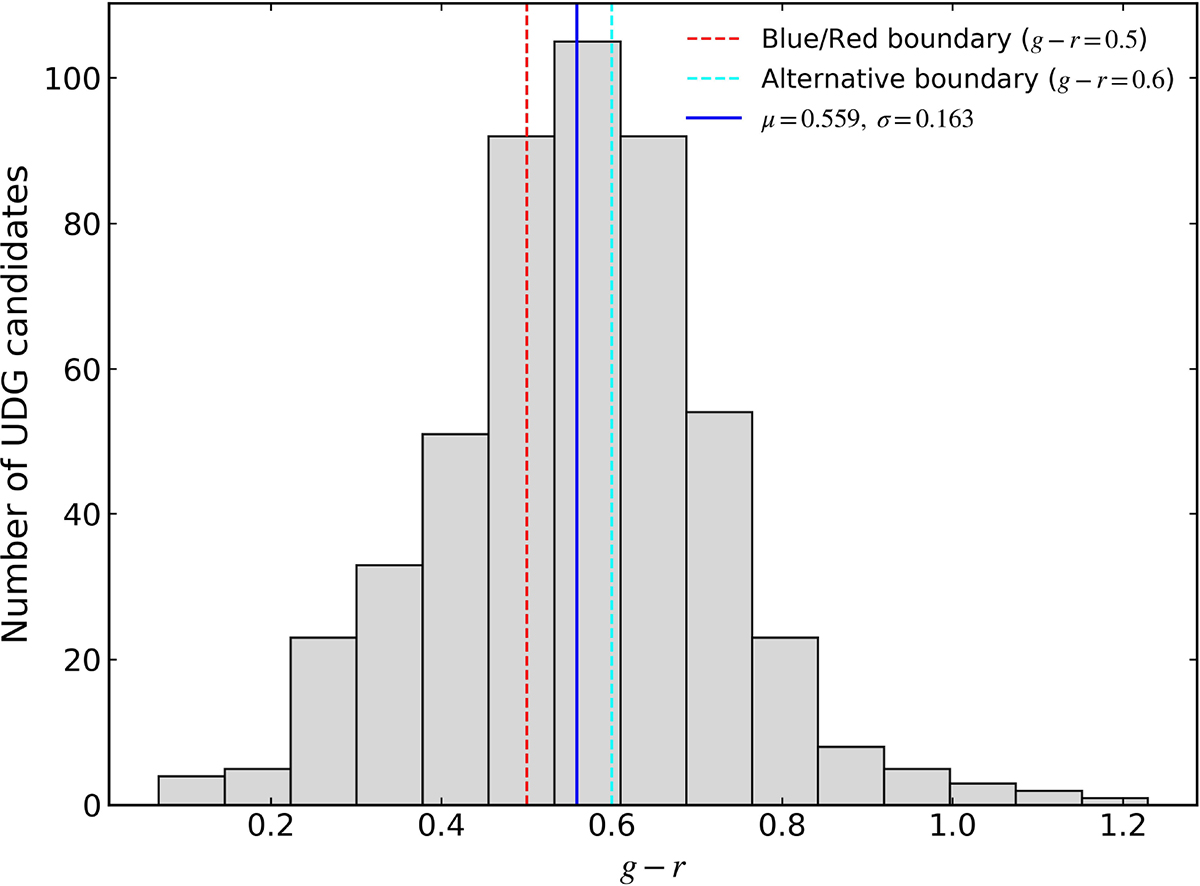
Color distribution of HQ UDG candidates. The histogram shows the distribution of g − r colors, which is approximately Gaussian with a mean of 0.559 and a standard deviation of 0.163. The sample spans a broad range from blue to red systems without a pronounced bimodality.
Current usage metrics show cumulative count of Article Views (full-text article views including HTML views, PDF and ePub downloads, according to the available data) and Abstracts Views on Vision4Press platform.
Data correspond to usage on the plateform after 2015. The current usage metrics is available 48-96 hours after online publication and is updated daily on week days.
Initial download of the metrics may take a while.