Fig. 8.
Download original image
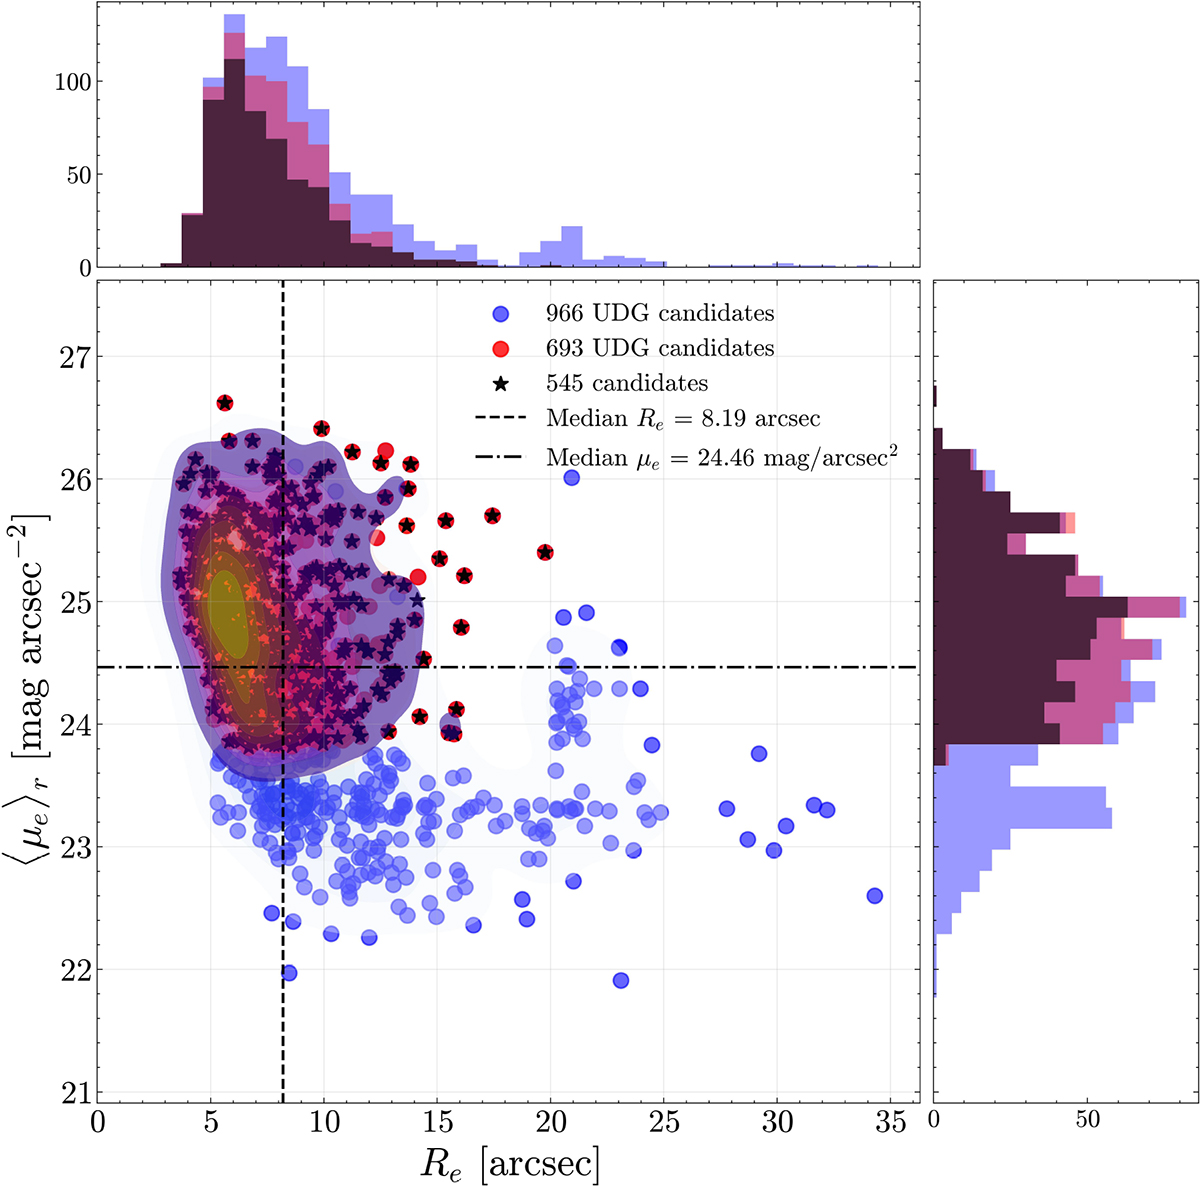
Distribution of effective radius, Re, and mean effective surface brightness, ⟨μe⟩r, of UDG candidates. Blue circles: Full catalog of 966 candidates. Red circles: 693 candidates meeting the selection criteria (3″ < Re < 20″, ⟨μe⟩r > 23.8 mag/arcsec2). Black stars: 545 HQ Grade A candidates (see Sect. 5.1). Shaded density contours and axis histograms show the distributions of each sample. Dashed black lines indicate the median values of Re and ⟨μe⟩r.
Current usage metrics show cumulative count of Article Views (full-text article views including HTML views, PDF and ePub downloads, according to the available data) and Abstracts Views on Vision4Press platform.
Data correspond to usage on the plateform after 2015. The current usage metrics is available 48-96 hours after online publication and is updated daily on week days.
Initial download of the metrics may take a while.