Fig. 1.
Download original image
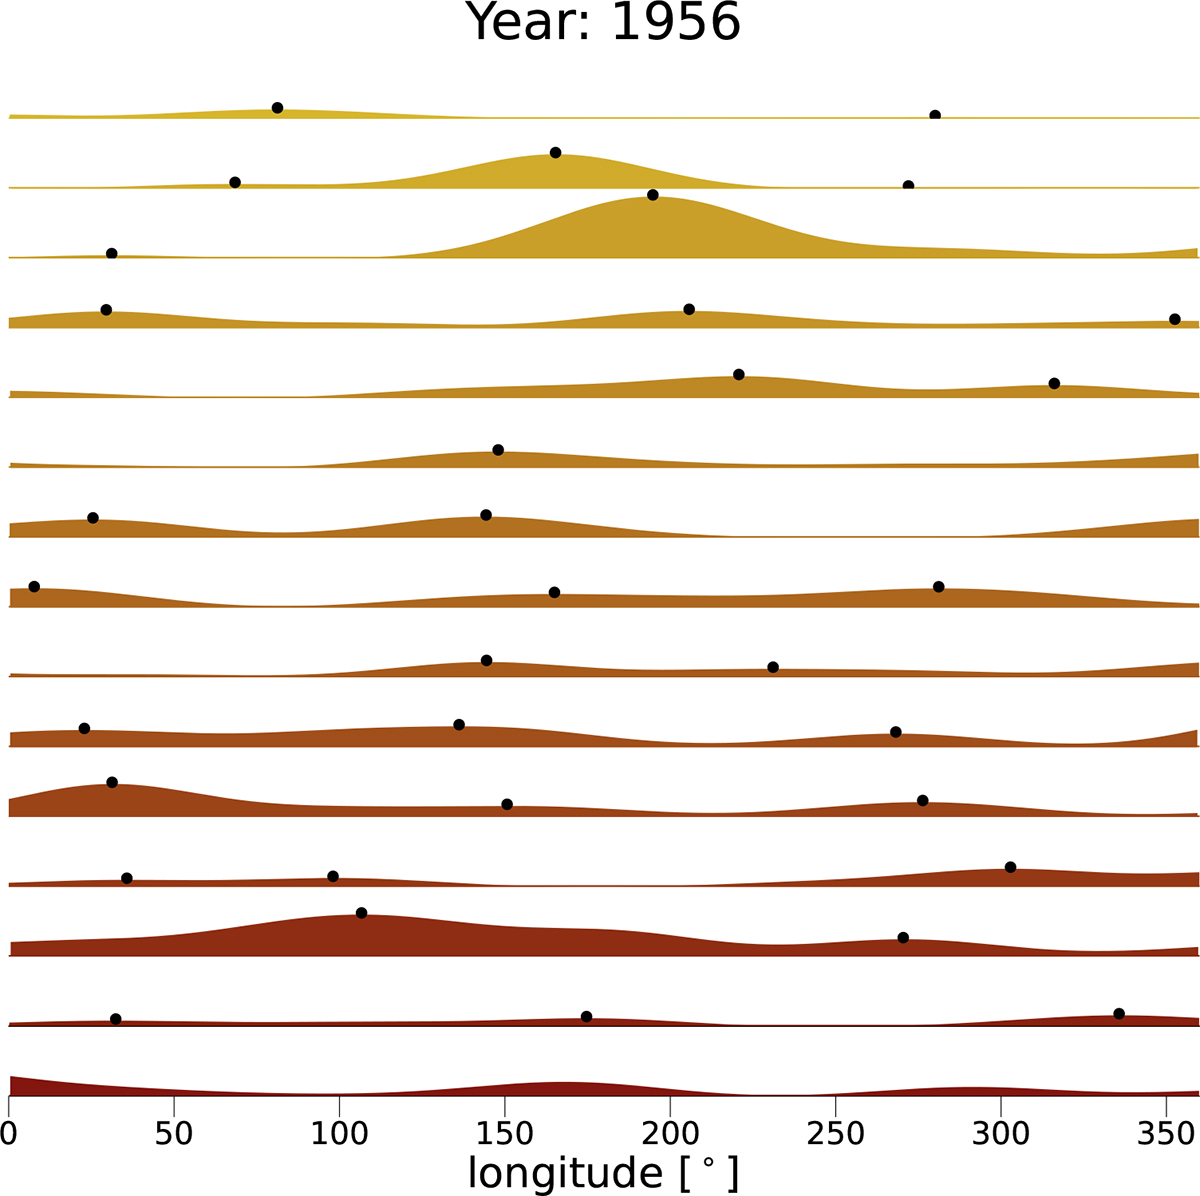
Ridge plot showing the longitudinal distribution of sunspot group activity during the year 1956. Each strip represents a single CR within the year. Note that they do not necessarily begin or end in that year. The x axis shows Carrington longitude within the individual CRs shown, while the y axis is proportional to the probability density determined by the KDE.
Current usage metrics show cumulative count of Article Views (full-text article views including HTML views, PDF and ePub downloads, according to the available data) and Abstracts Views on Vision4Press platform.
Data correspond to usage on the plateform after 2015. The current usage metrics is available 48-96 hours after online publication and is updated daily on week days.
Initial download of the metrics may take a while.