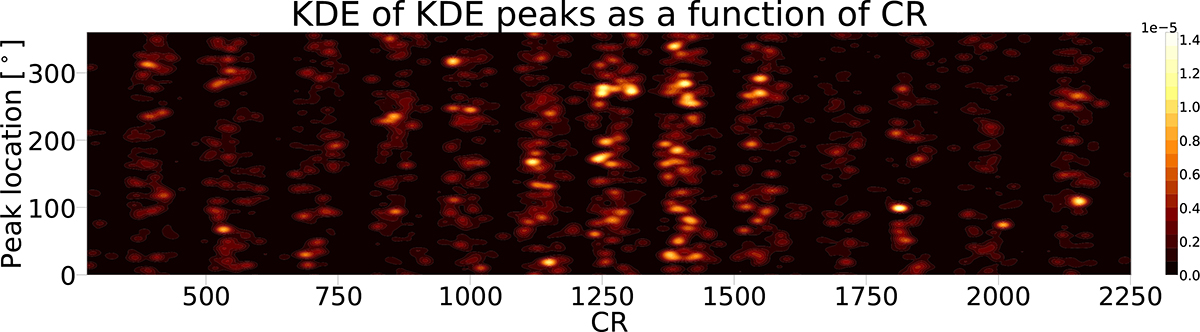
Fig. 2.
Download original image
2D KDE analysis of the full sunspot group longitude data series, shown as a function of CR and longitude. Based on the locations of KDE peaks from the 1D KDE constructed from individual CRs. The colour scale indicates the probability density, with brighter regions corresponding to higher concentrations of activity, and thus potential ALs.
Current usage metrics show cumulative count of Article Views (full-text article views including HTML views, PDF and ePub downloads, according to the available data) and Abstracts Views on Vision4Press platform.
Data correspond to usage on the plateform after 2015. The current usage metrics is available 48-96 hours after online publication and is updated daily on week days.
Initial download of the metrics may take a while.