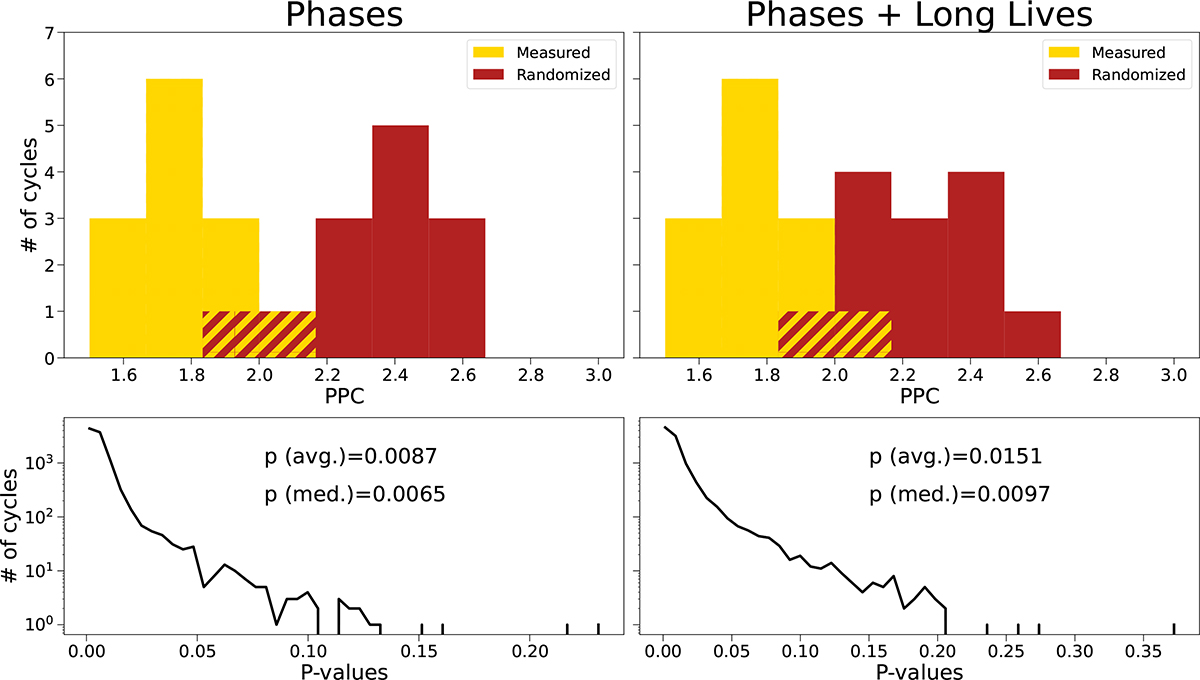
Fig. 9.
Download original image
Upper panels: histograms of the # of 1D KDE peaks found per CR for the measured sunspot data and samples from randomly generated solar cycles for two cases. Solar cycles have an increasing and a decreasing phase of activity, and sunspots can live up to multiple CRs. The randomised data are of 13 cycles randomly chosen from our samples for each case. Bottom panels: Histograms of the Cucconi test p values for 10 000 groups of 13 randomly sampled solar cycles from the random numbers generator, corresponding to the cases of the upper panels.
Current usage metrics show cumulative count of Article Views (full-text article views including HTML views, PDF and ePub downloads, according to the available data) and Abstracts Views on Vision4Press platform.
Data correspond to usage on the plateform after 2015. The current usage metrics is available 48-96 hours after online publication and is updated daily on week days.
Initial download of the metrics may take a while.