Fig. 1.
Download original image
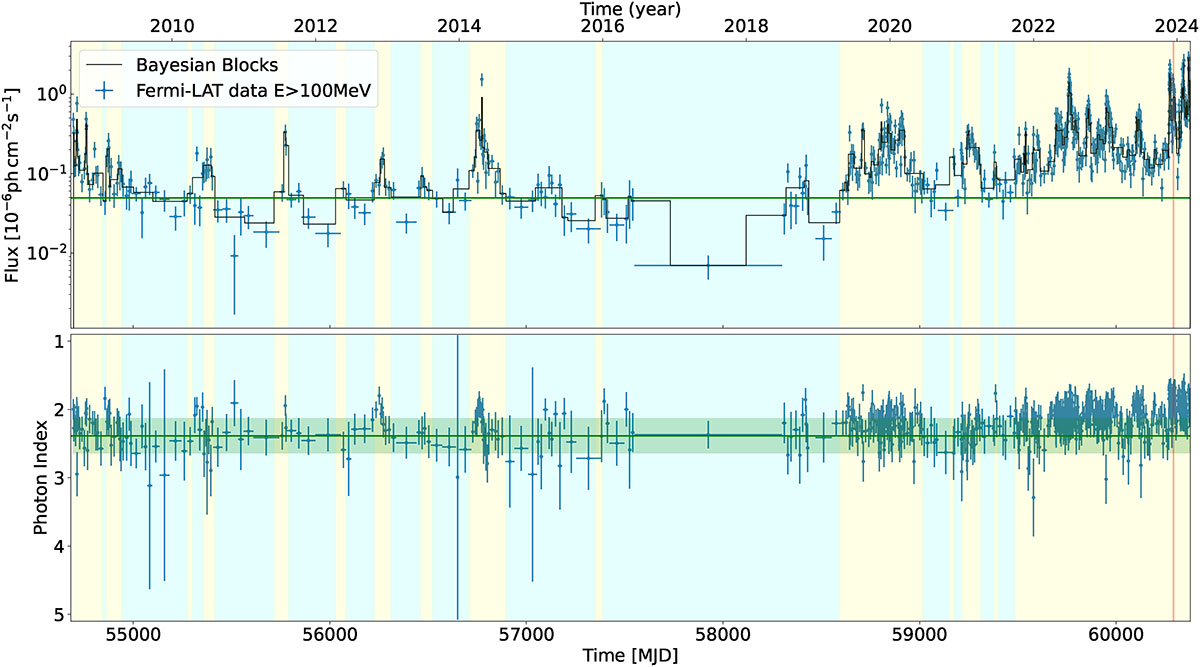
Top: 15-year Fermi-LAT light curve of OP 313, divided into quiescent (blue) and flaring (yellow) states. The green line shows the time-weighted average flux of 4.93 × 10⁻⁸ photons/cm2s computed between 9 December 2014 and 9 August 2018. Bottom: Fermi-LAT photon index over the same 15-year period. The green line shows the average photon index computed between 9 December 2014 and 9 August 2018 (Γ = 2.39), with the green band indicating its corresponding 1σ uncertainty. The red vertical bands highlight the period in which LST-1 detected OP 313.
Current usage metrics show cumulative count of Article Views (full-text article views including HTML views, PDF and ePub downloads, according to the available data) and Abstracts Views on Vision4Press platform.
Data correspond to usage on the plateform after 2015. The current usage metrics is available 48-96 hours after online publication and is updated daily on week days.
Initial download of the metrics may take a while.