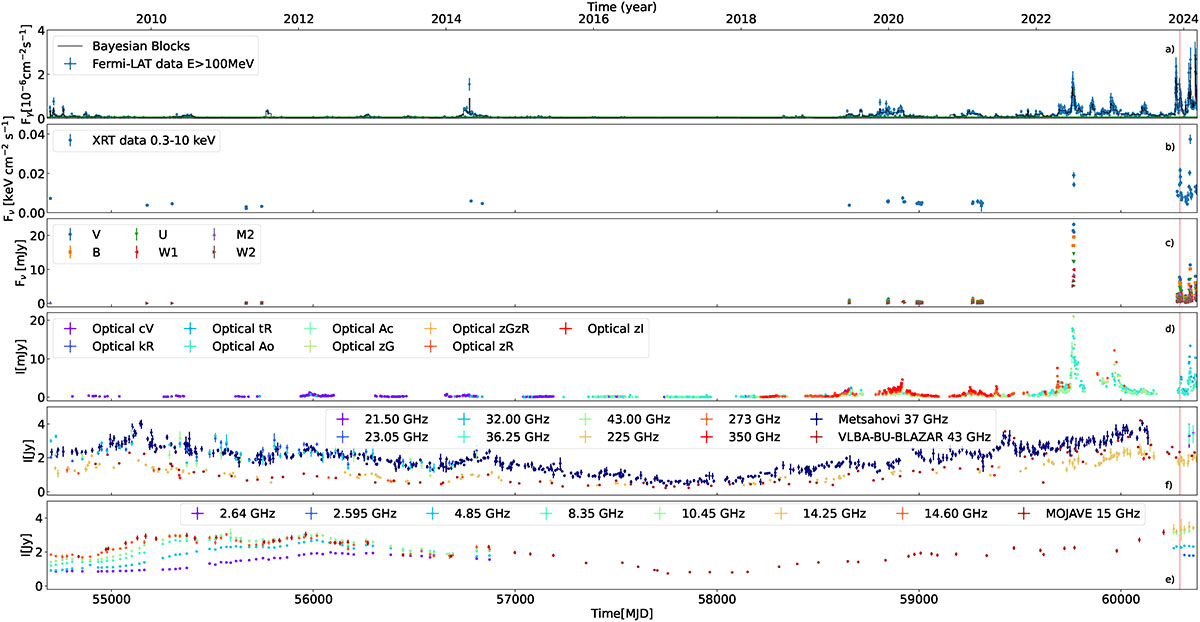
Fig. 2.
Download original image
Multiwavelength light curve of OP 313. The red vertical band indicates the period when LST-1 detected OP 313. a: Fermi-LAT light curve at E > 100 MeV. b: Swift-XRT X-ray light curve from 0.3 keV to 10 keV. c: Swift-UVOT light curve in the optical/UV bands. d: Optical light curve from several facilities and filters: CRTS V-filter (cV), KAIT R-filter (kR), Tuorla R-filter (tR), ATLAS o (Ao) and c-filters (Ac), and Palomar ZTF g, r, and i-filters (zG, zR, and zI). The label zGzR refers to ZTF observations using both g and r filters. e: Radio Single Dish FERMI-GST AGN Multi-frequency Monitoring Alliance (F-GAMMA) light curves above 15 GHz, Submillimeter Array (SMA) data at 225, 273 and 350 GHz, including SMAPOL data at 225 GHz light curves, Metsähovi at 37 GHz and VLBA-BU-BLAZAR at 43 GHz light curves. f: Radio Single Dish F-GAMMA light curves below 15 GHz and MOJAVE VLBA light curve.
Current usage metrics show cumulative count of Article Views (full-text article views including HTML views, PDF and ePub downloads, according to the available data) and Abstracts Views on Vision4Press platform.
Data correspond to usage on the plateform after 2015. The current usage metrics is available 48-96 hours after online publication and is updated daily on week days.
Initial download of the metrics may take a while.