Open Access
Fig. 6.
Download original image
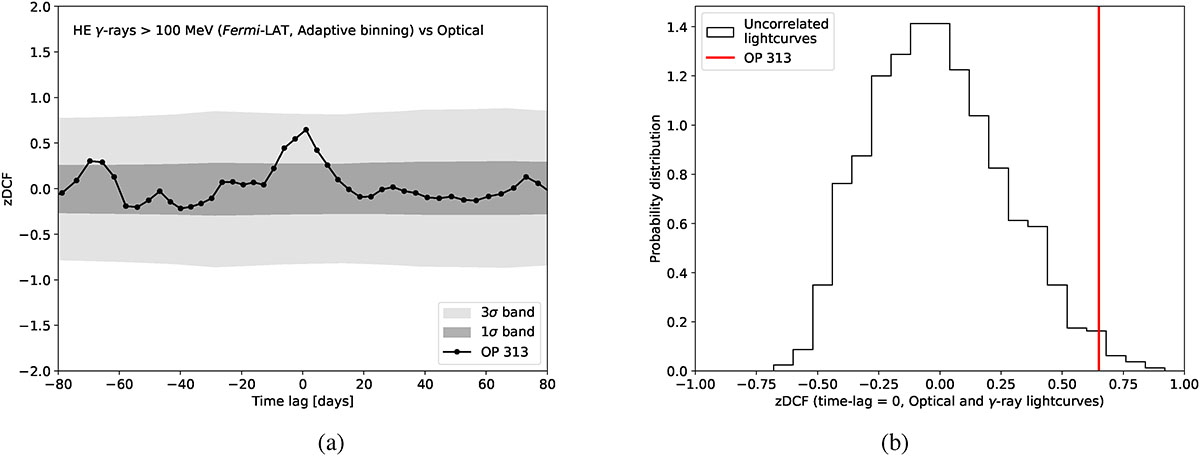
(a) zDCF analysis on the short-term period of OP 313 optical and γ-ray light curves; and (b) distribution of the reconstructed zDCF at zero time-lag for 104 simulated uncorrelated γ-ray and optical light curves. The red line marks the reconstructed zDCF value with the observed OP 313 light curves in Figure 3.
Current usage metrics show cumulative count of Article Views (full-text article views including HTML views, PDF and ePub downloads, according to the available data) and Abstracts Views on Vision4Press platform.
Data correspond to usage on the plateform after 2015. The current usage metrics is available 48-96 hours after online publication and is updated daily on week days.
Initial download of the metrics may take a while.