Open Access
Fig. 8.
Download original image
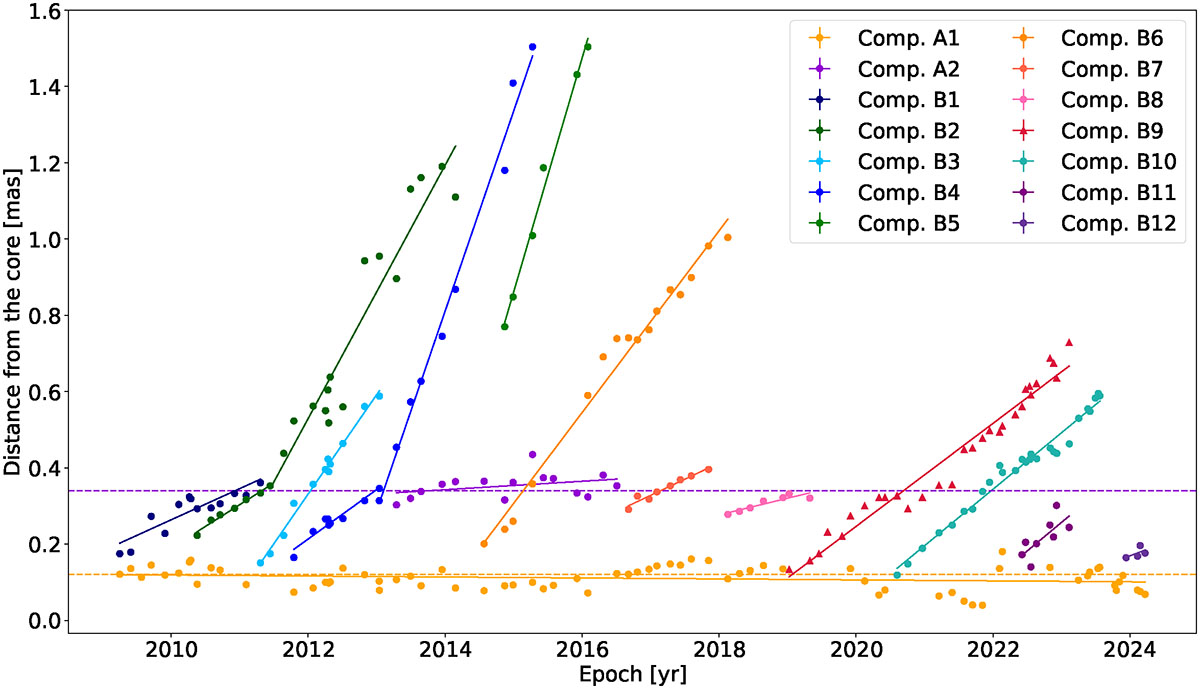
Angular separation from the core versus time for Gaussian jet features of the VLBA-BU-BLAZAR (VLBA-BU-BLAZAR) data. Colored symbols indicate robust features for which kinematic fits were obtained. The 2 dashed lines in yellow and purple represent the static shocks’ mean distance from the core.
Current usage metrics show cumulative count of Article Views (full-text article views including HTML views, PDF and ePub downloads, according to the available data) and Abstracts Views on Vision4Press platform.
Data correspond to usage on the plateform after 2015. The current usage metrics is available 48-96 hours after online publication and is updated daily on week days.
Initial download of the metrics may take a while.