Fig. 9.
Download original image
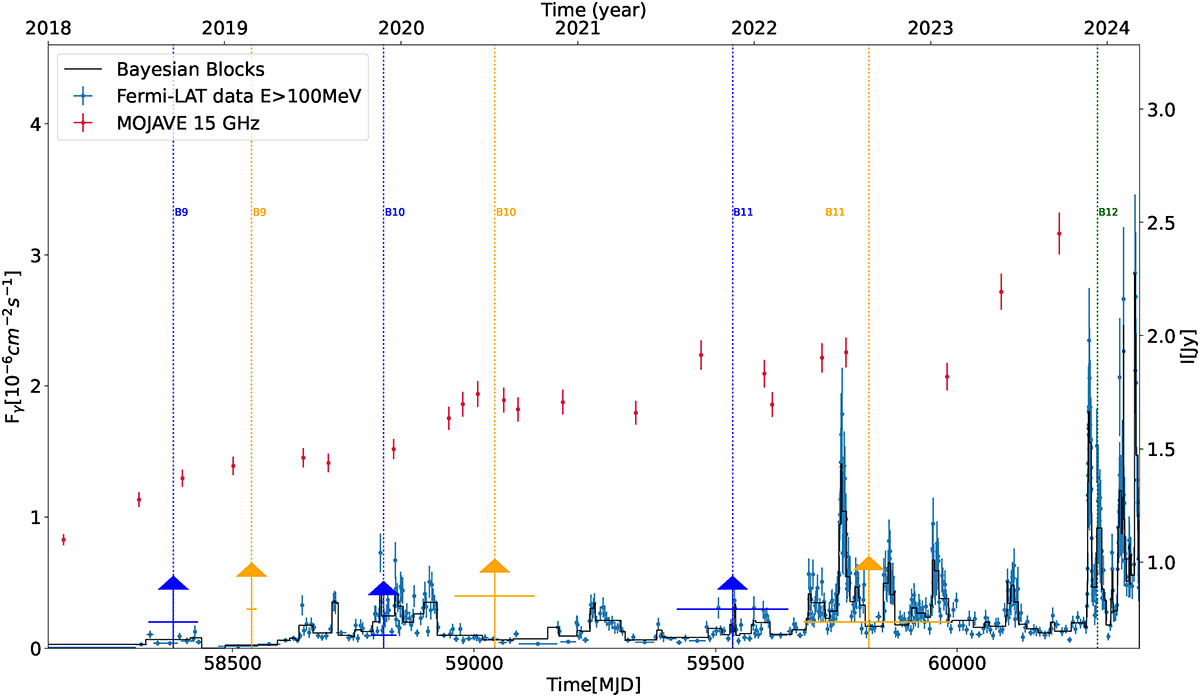
Comparison between the Fermi-LAT data (in blue) with their Bayesian blocks (in black) and the total flux density of MOJAVE data at 15 GHz (in red). The dashed blue lines represent the time of ejections for different knots, found in the VLBA-BU-BLAZAR visibilities, and the blue lines are the corresponding errors, while the orange dashed lines represent the epochs when the knots encounter the standing shock “A1” with the corresponding errors. In green, the epoch in which “B12” was found.
Current usage metrics show cumulative count of Article Views (full-text article views including HTML views, PDF and ePub downloads, according to the available data) and Abstracts Views on Vision4Press platform.
Data correspond to usage on the plateform after 2015. The current usage metrics is available 48-96 hours after online publication and is updated daily on week days.
Initial download of the metrics may take a while.