Fig. 1
Download original image
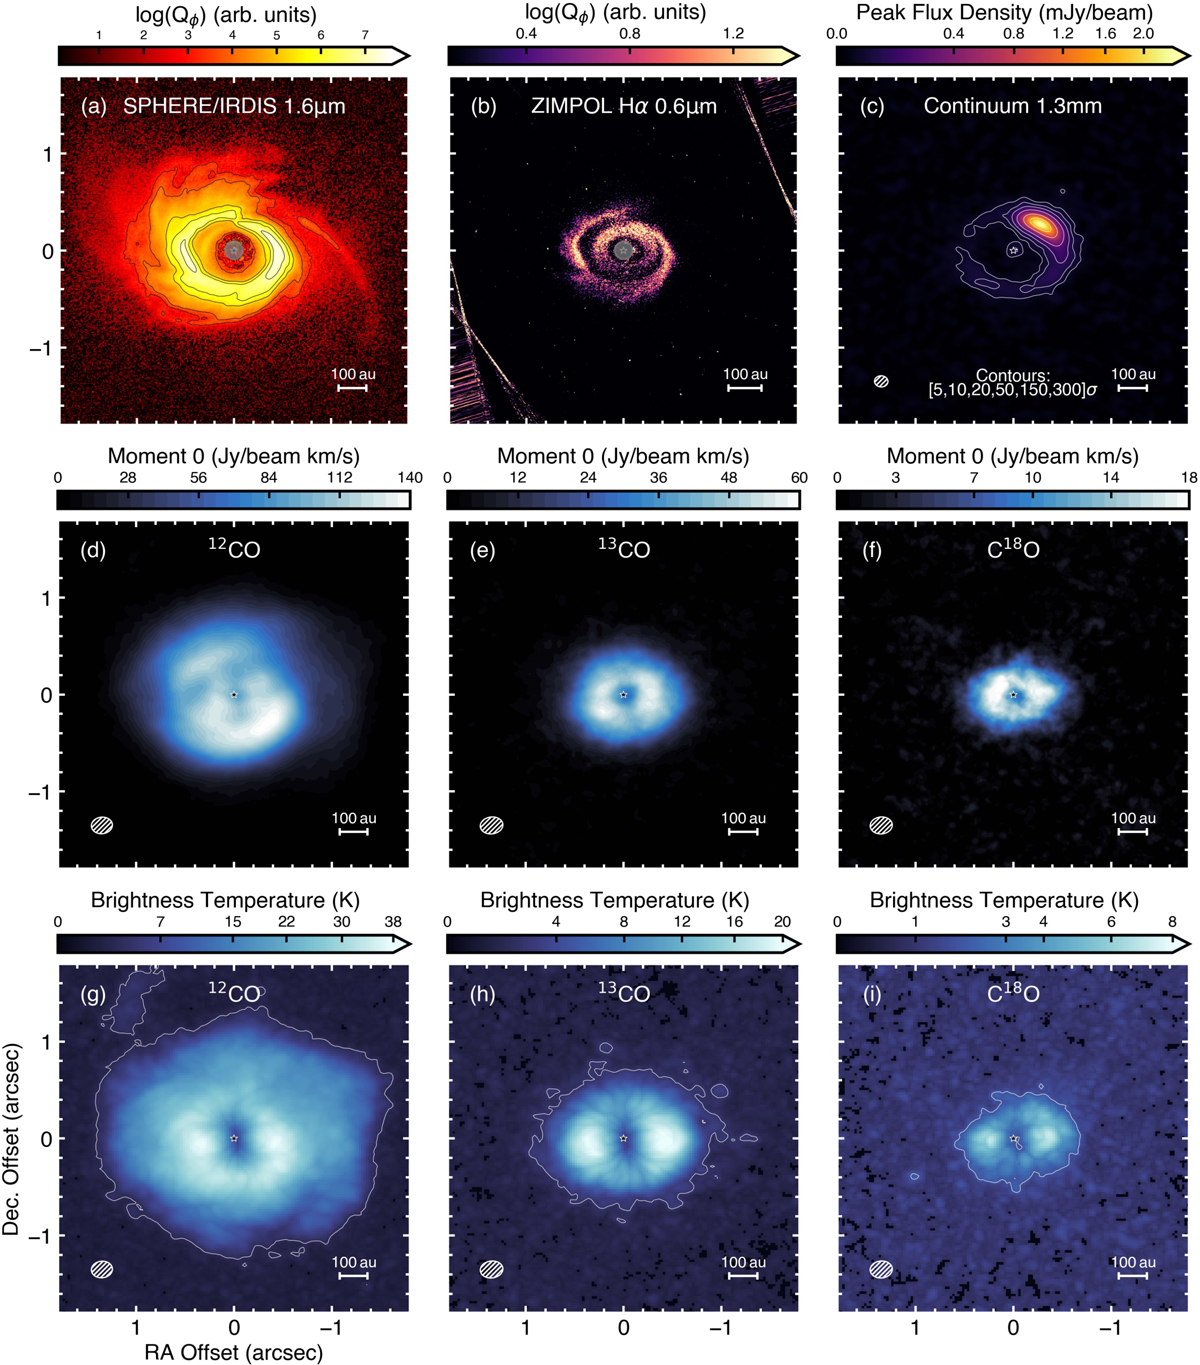
Multi-wavelengths observations of HD 34700A. (a) SPHERE/IRDIS IR scattered light observations and (b) ZIMPOL Hα observations presented in Columba et al. (2024), with the gray circles representing the coronograph (r = 92.5 mas ≈ 32 au). (c) ALMA 225.3 GHz continuum observations. (d), (e), and (f) show the moment 0 maps for the 12CO, 13CO, and C18O fiducial cubes, while (g), (h), and (i) show the peak intensity maps for the same cubes, respectively. The brightness temperature was computed using the Rayleigh-Jeans approximation. The white contour in the peak intensity maps encloses 5σ of the root-mean-square (RMS) noise of each line. The location of the spectroscopic binary is highlighted with the star. The beam size is shown in the lower left corner for the ALMA observations.
Current usage metrics show cumulative count of Article Views (full-text article views including HTML views, PDF and ePub downloads, according to the available data) and Abstracts Views on Vision4Press platform.
Data correspond to usage on the plateform after 2015. The current usage metrics is available 48-96 hours after online publication and is updated daily on week days.
Initial download of the metrics may take a while.