Fig. E.1
Download original image
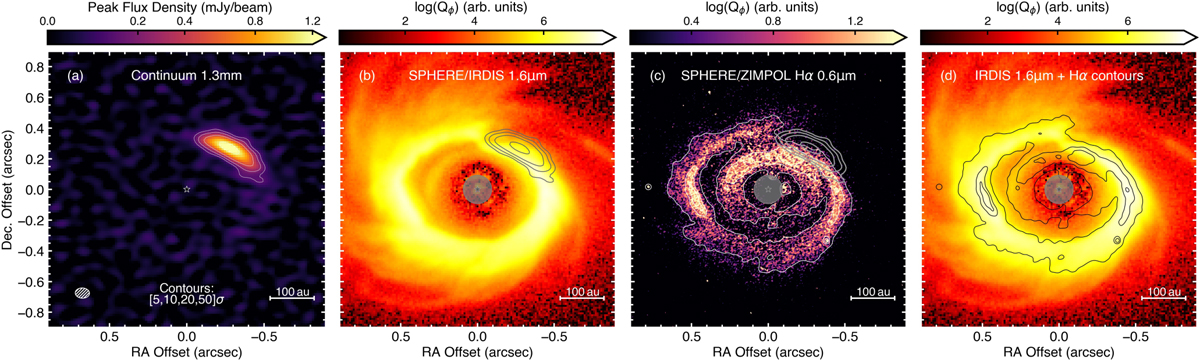
Gallery of HD 34700A dust images. (a) High-resolution (92 × 66 mas2) 225.3 GHz dust continuum. (b) SPHERE/IRDIS IR scattered light observations and (c) SPHERE/ZIMPOL Hα observations presented in Columba et al. (2024), with the gray circles representing the coronograph (r = 92.5 mas ≈ 32 au). Overlaid dust continuum contours are the same as in (a). (d) IR scattered light observations with Hα contours of (c).
Current usage metrics show cumulative count of Article Views (full-text article views including HTML views, PDF and ePub downloads, according to the available data) and Abstracts Views on Vision4Press platform.
Data correspond to usage on the plateform after 2015. The current usage metrics is available 48-96 hours after online publication and is updated daily on week days.
Initial download of the metrics may take a while.