Fig. E.2
Download original image
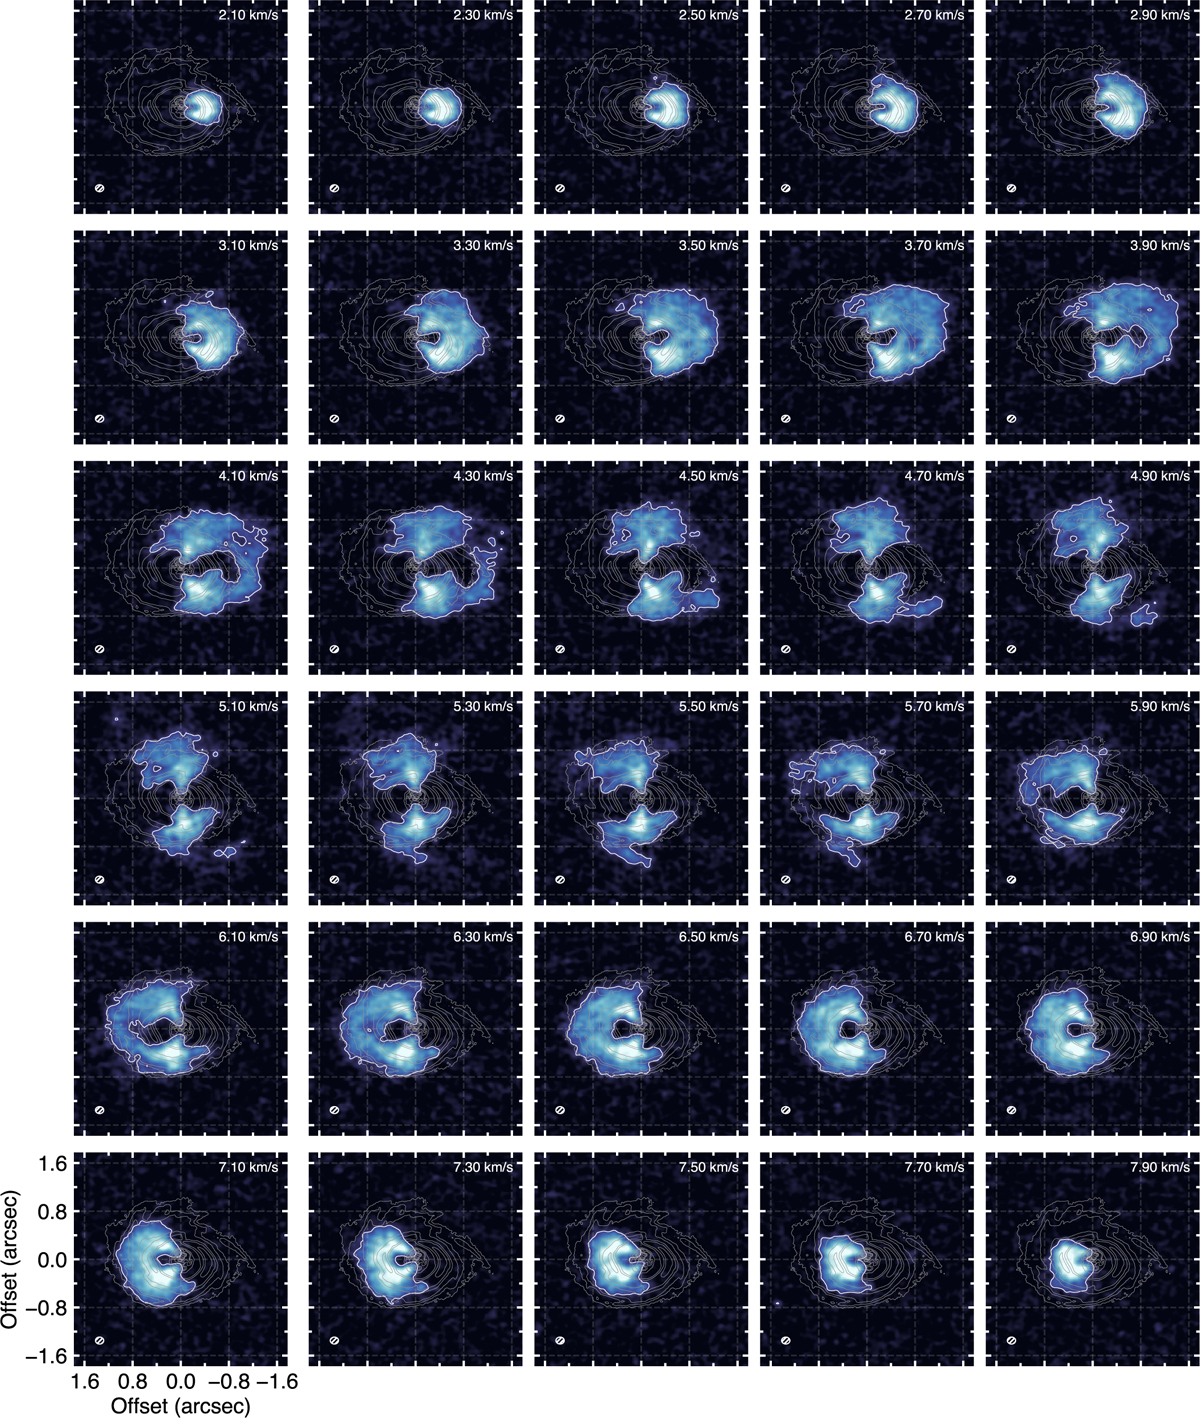
Channel maps for the 12CO J = 2-1 molecular line. The white contour enclosing the line emission shows 5σ. The gray background contours indicate the scattered light emission, same as Fig. 1 (a), to highlight that the spiral spurs in the line emission closely follow the IR ring. The beam size of the high-resolution cube is plotted in the lower left corner. Note that we only show every second channel (200ms−1), and the systemic-velocity channel is at 5.1 km s−1. A movie of the 12CO channel maps can be found in the online resources.
Current usage metrics show cumulative count of Article Views (full-text article views including HTML views, PDF and ePub downloads, according to the available data) and Abstracts Views on Vision4Press platform.
Data correspond to usage on the plateform after 2015. The current usage metrics is available 48-96 hours after online publication and is updated daily on week days.
Initial download of the metrics may take a while.