Fig. E.5
Download original image
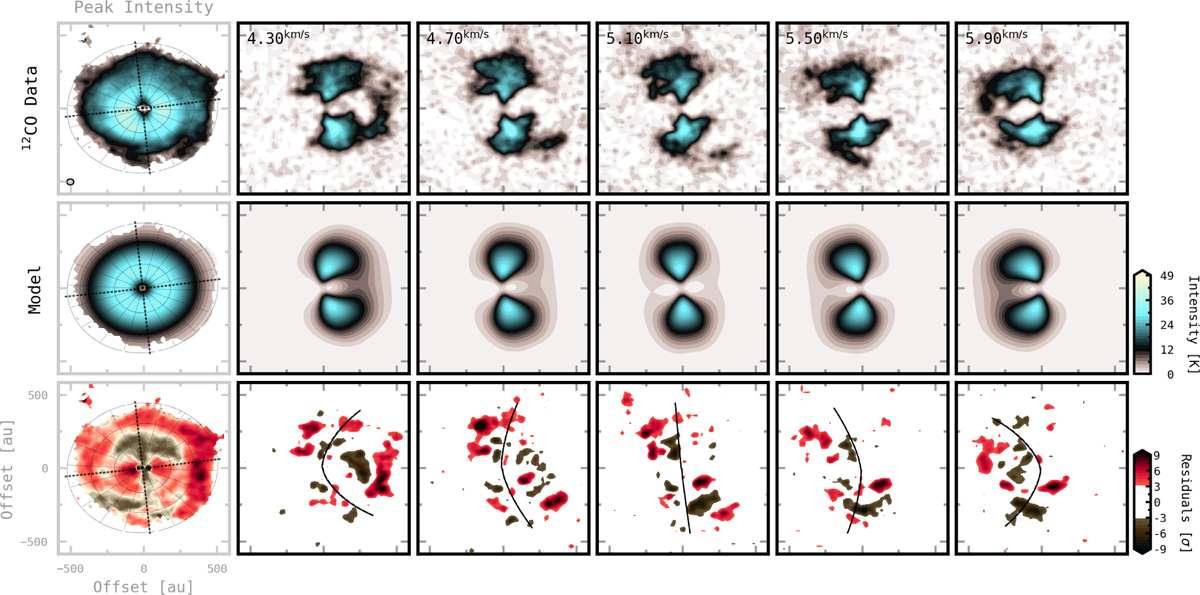
Selected line intensity channels for 12CO J = 2-1 using the high-resolution cubes. The panels for each figure display the data channels, the best-fit model, and the residuals, from top to bottom. Residuals below 3σ = 5.0 K are whited out. The systemic-velocity channel is at 5.1km s−1, and the left-most panels show the corresponding peak intensity maps.
Current usage metrics show cumulative count of Article Views (full-text article views including HTML views, PDF and ePub downloads, according to the available data) and Abstracts Views on Vision4Press platform.
Data correspond to usage on the plateform after 2015. The current usage metrics is available 48-96 hours after online publication and is updated daily on week days.
Initial download of the metrics may take a while.