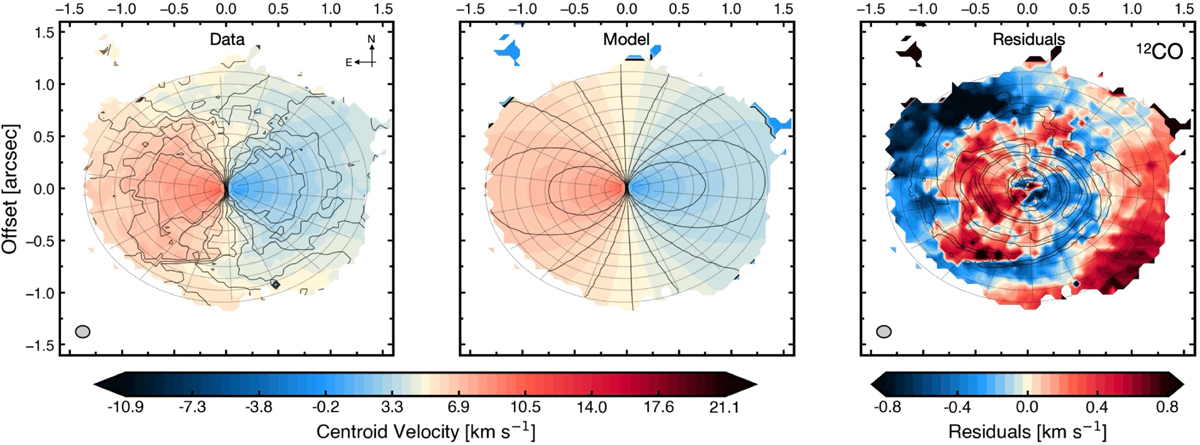
Fig. E.8
Download original image
12CO quadratic velocity residuals. Here we use the bettermoments “quadratic” centroid moment, which fits a quadratic function to the peak of the line and its two neighboring pixel to determine the line centroid (Teague 2019b). The employed 12CO robust 0.5 cube, Keplerian discminer model, and layout is the same as in Fig. 7. The quadratic LoS velocity map of the data differs from the Gaussian one of Fig. 7. The “quadratic” line centroid traces more closely the peak of the emission, hence leading to strong bending of the iso-velocity contours coinciding with the regions of broadened line-profiles, as highlighted in the map of Fig. 6. In particular, at the location of the infalling material in the southeast, this leads to a strong blue- or redshifted residual due to the double-peaked line profile at this location.
Current usage metrics show cumulative count of Article Views (full-text article views including HTML views, PDF and ePub downloads, according to the available data) and Abstracts Views on Vision4Press platform.
Data correspond to usage on the plateform after 2015. The current usage metrics is available 48-96 hours after online publication and is updated daily on week days.
Initial download of the metrics may take a while.