Fig. 2
Download original image
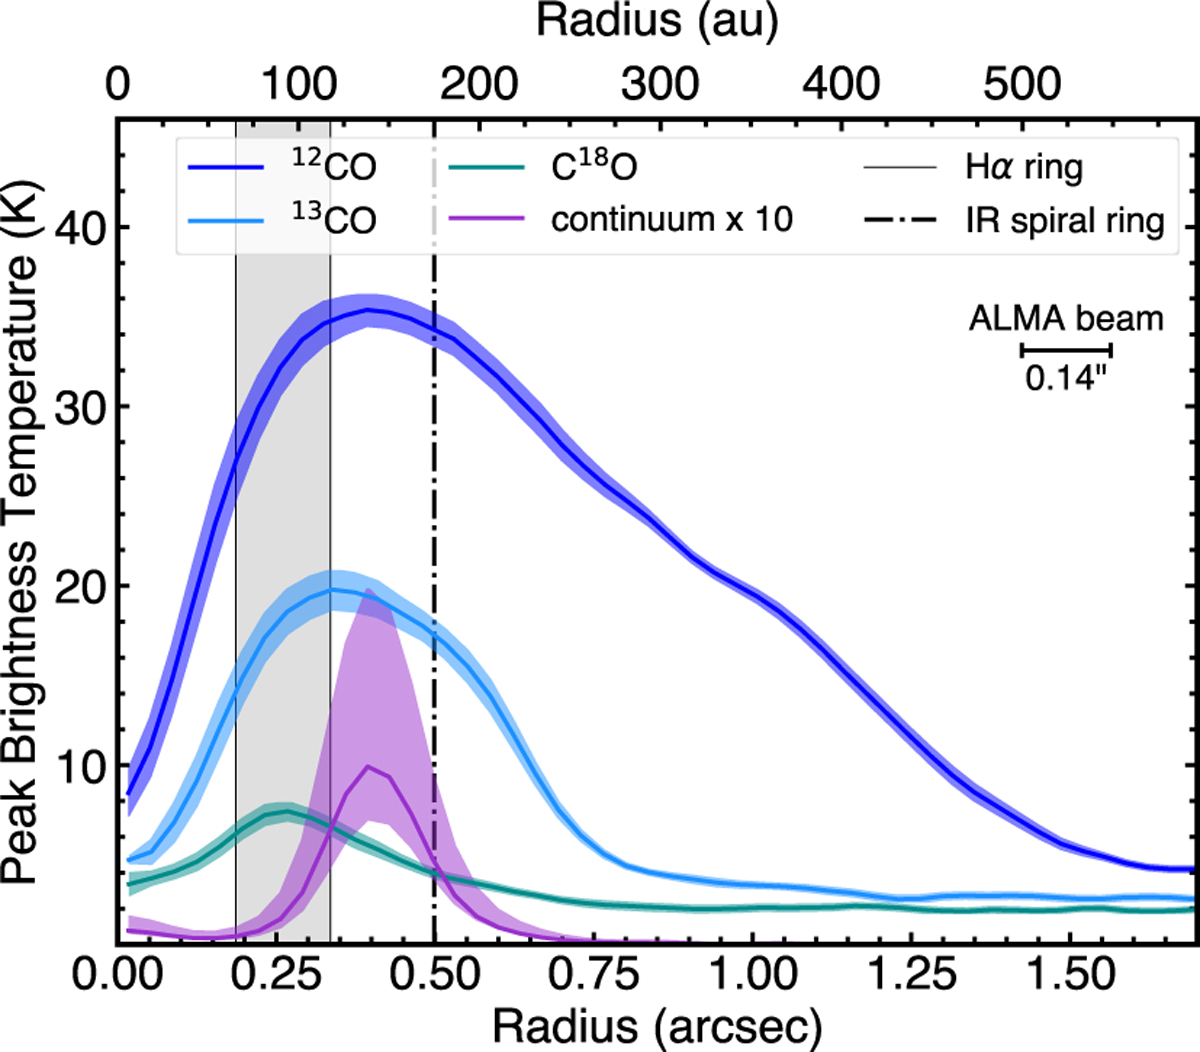
Brightness temperature radial profiles of CO isotopologs and dust continuum using the high-resolution cubes 0″.14 × 0″.11 (49 × 39 au) cubes. The latter was multiplied by a factor of 10 to enhance visibility. The colored shaded region shows the standard deviation within each annulus. For the asymmetric continuum emission this traces the pronounced azimuthal variations, rather than an error. The gray-shaded area shows the extent of the Hα ring, and the dashed-dotted line shows the peak of the IR ring (values from Columba et al. 2024; Uyama et al. 2020, respectively).
Current usage metrics show cumulative count of Article Views (full-text article views including HTML views, PDF and ePub downloads, according to the available data) and Abstracts Views on Vision4Press platform.
Data correspond to usage on the plateform after 2015. The current usage metrics is available 48-96 hours after online publication and is updated daily on week days.
Initial download of the metrics may take a while.