Open Access
Fig. 3
Download original image
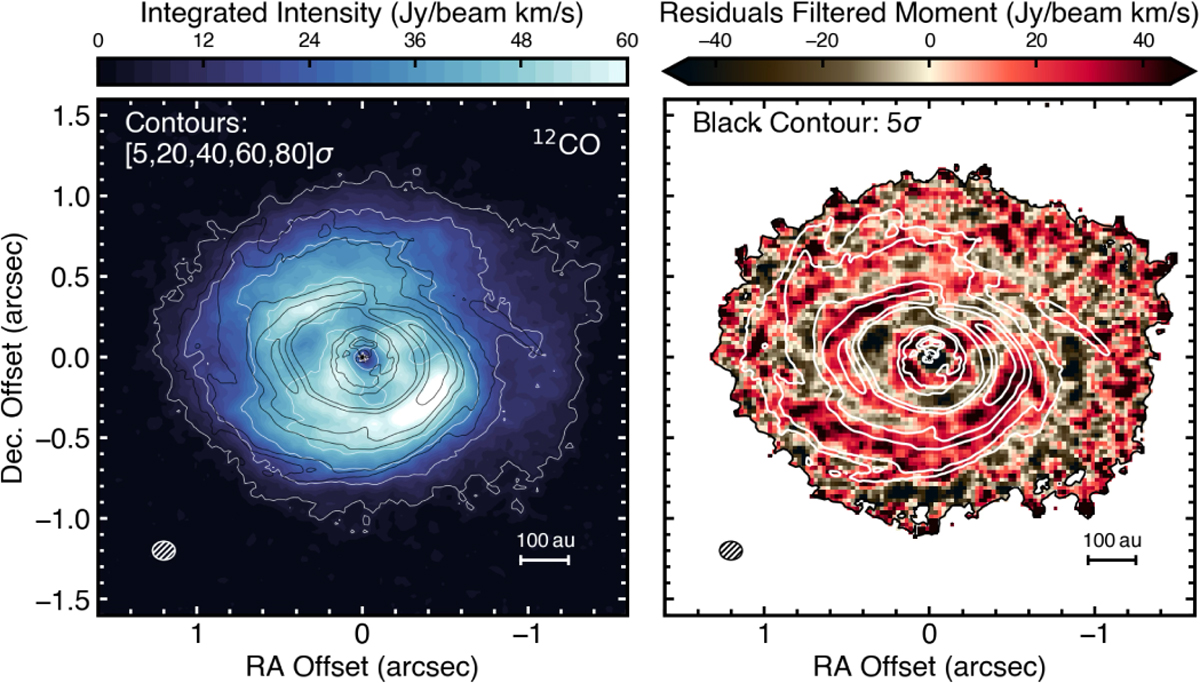
Line emission features of 12CO. Left: moment 0 map using the high-resolution cube. Right: residuals from a moment 0 map subtracted with a high-pass filtered moment map, limited to disk emission above 5 σ. The black and white contours in both maps highlight the IR emission, identical to Fig. 1a.
Current usage metrics show cumulative count of Article Views (full-text article views including HTML views, PDF and ePub downloads, according to the available data) and Abstracts Views on Vision4Press platform.
Data correspond to usage on the plateform after 2015. The current usage metrics is available 48-96 hours after online publication and is updated daily on week days.
Initial download of the metrics may take a while.