Fig. 5
Download original image
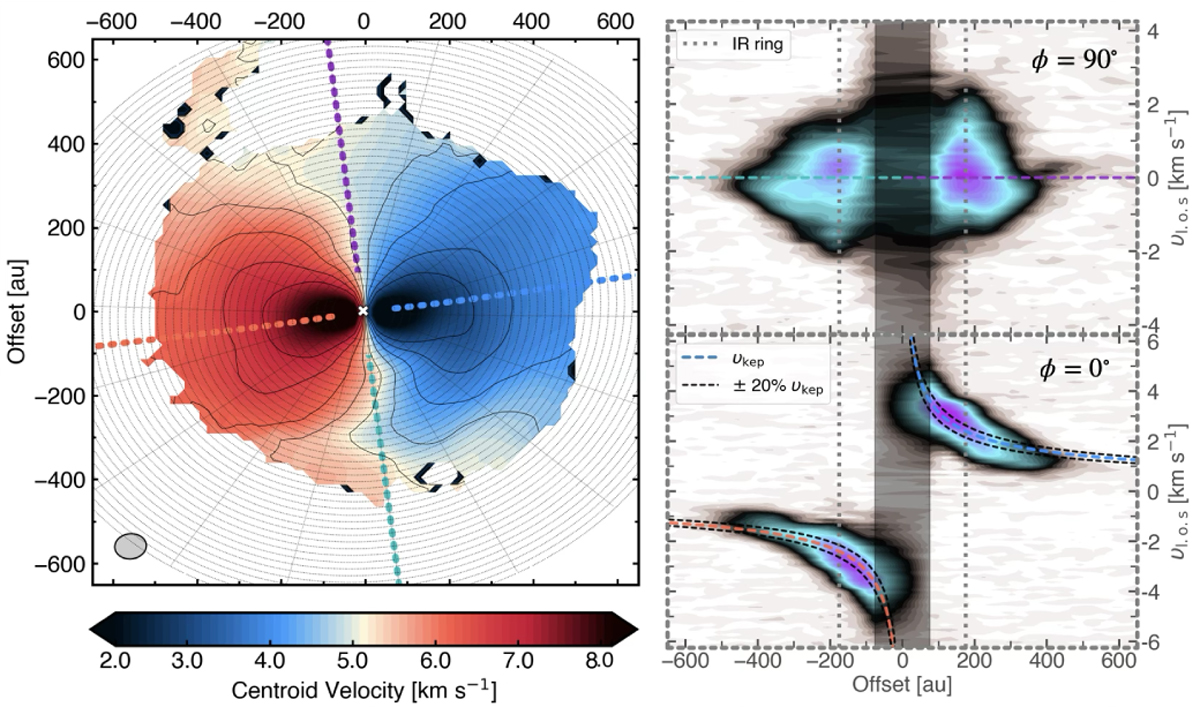
12CO position-velocity diagram for fiducial cube. Spectra are extracted along all four angles of the major (red and blue at φ = 0°) and minor (cyan and purple at φ = 90°) disk axes, as highlighted in the Gaussian centroid moment map (left panel). The dashed lines in the PV diagrams (colors corresponding to axes on the left) highlight the disk’s Keplerian rotation. The gray shaded areas mask one major beam size in radius from the center. In the φ = 0 panel, the enclosing black dashed lines correspond to 20% deviations from Keplerian rotation. The location of the IR ring (R = 175 au) is plotted in gray dotted lines in both PV diagrams.
Current usage metrics show cumulative count of Article Views (full-text article views including HTML views, PDF and ePub downloads, according to the available data) and Abstracts Views on Vision4Press platform.
Data correspond to usage on the plateform after 2015. The current usage metrics is available 48-96 hours after online publication and is updated daily on week days.
Initial download of the metrics may take a while.