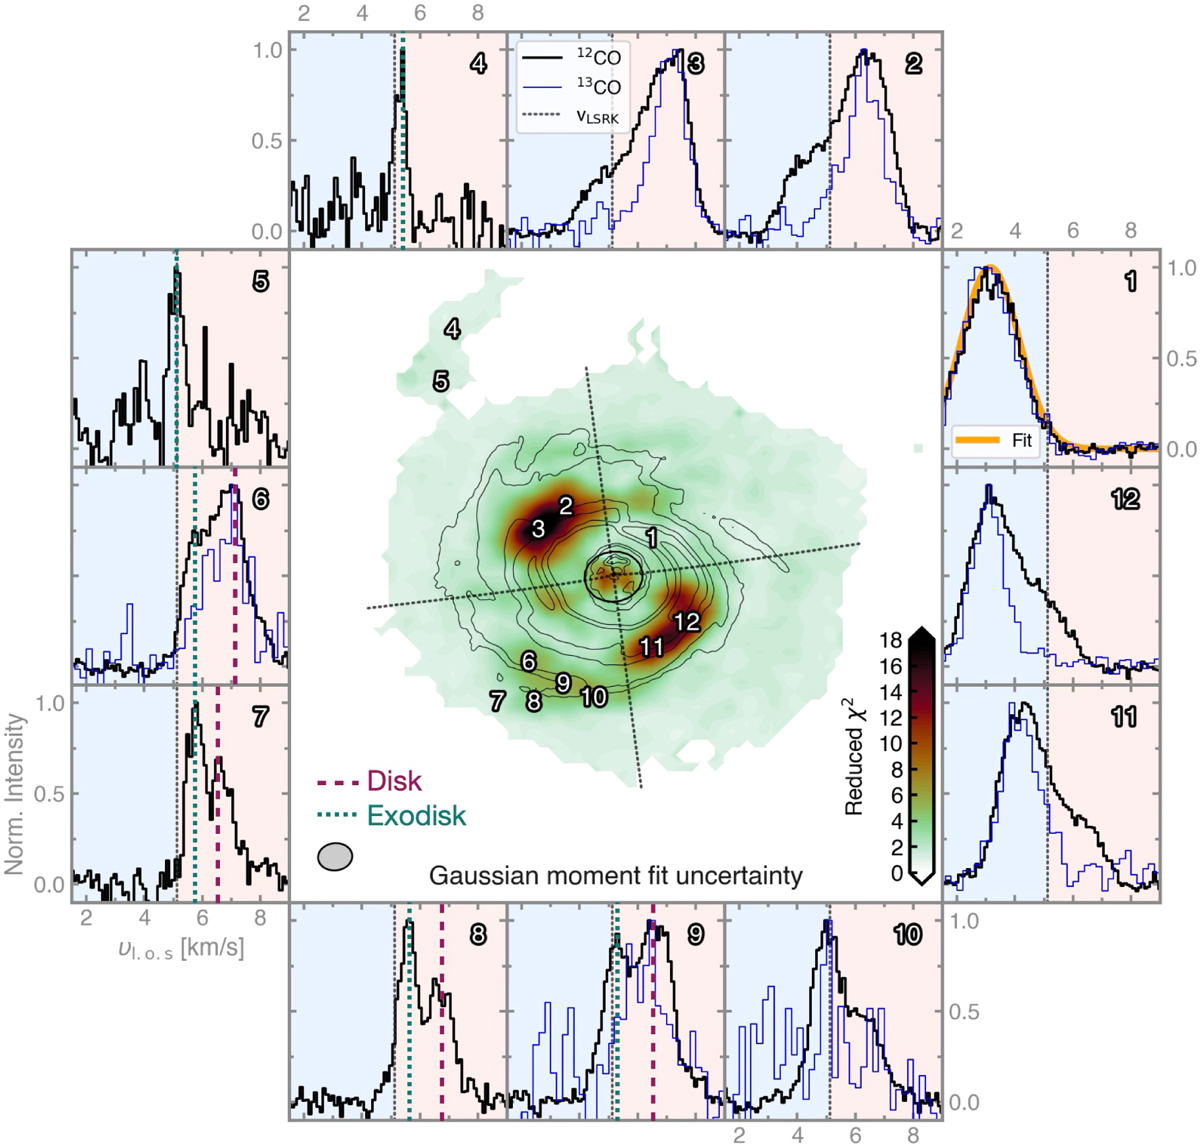
Fig. 6
Download original image
Line spectra diagnostics. Selected 12CO (black) and 13CO (blue) spectra normalized to their peak extracted at disk locations marked in the center map. The map shows the reduced-χ2 values (Eq. (2)) from the Gaussian moment map fit to the line profile (see accurate fit in panel 1), masked at 5σ. High uncertainties indicate non-Gaussian-shaped line profiles. The line profiles are split by the υLSRK into regions that are either blue-or redshifted to the systemic velocity. Pixels 6-9 that exhibit secondary components in their spectra that are tracing an “exodisk” line component (cyan vertical lines), in addition to the underlying rotating disk component (purple lines). The thin black contours show the IR scattered light as in Fig. 1a, the thick black ellipse highlights the inner edge of the Hα-ring, and the dotted lines highlight the disk’s minor and major axes.
Current usage metrics show cumulative count of Article Views (full-text article views including HTML views, PDF and ePub downloads, according to the available data) and Abstracts Views on Vision4Press platform.
Data correspond to usage on the plateform after 2015. The current usage metrics is available 48-96 hours after online publication and is updated daily on week days.
Initial download of the metrics may take a while.