Fig. B.1
Download original image
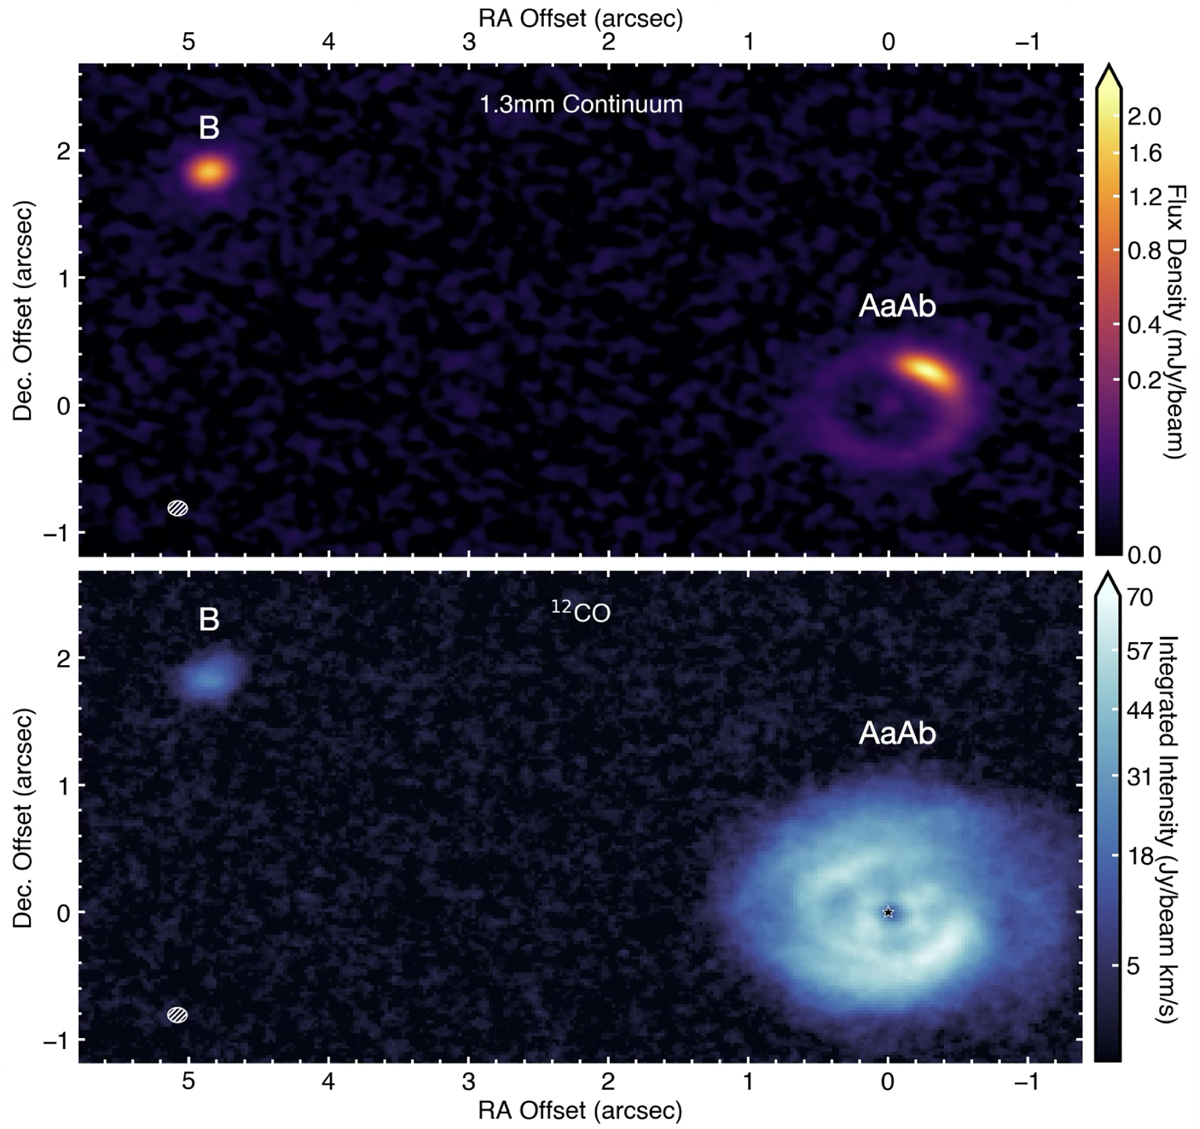
Overview plot of HD 34700 AaAb and B. Top: 225.3 GHz dust continuum emission plotted with a power-law scaling of γ = 0.4 to highlight faint emission. Bottom: 12CO J = 2-1 moment 0 map. The beam size (0714 × 0711) of the robust 0.5 cubes employed is shown in the lower-left corner. No continuum or 12CO molecular line emission was detected bridging both disks around HD 34700A and B, even when the data were imaged at a lower resolution and higher sensitivity.
Current usage metrics show cumulative count of Article Views (full-text article views including HTML views, PDF and ePub downloads, according to the available data) and Abstracts Views on Vision4Press platform.
Data correspond to usage on the plateform after 2015. The current usage metrics is available 48-96 hours after online publication and is updated daily on week days.
Initial download of the metrics may take a while.