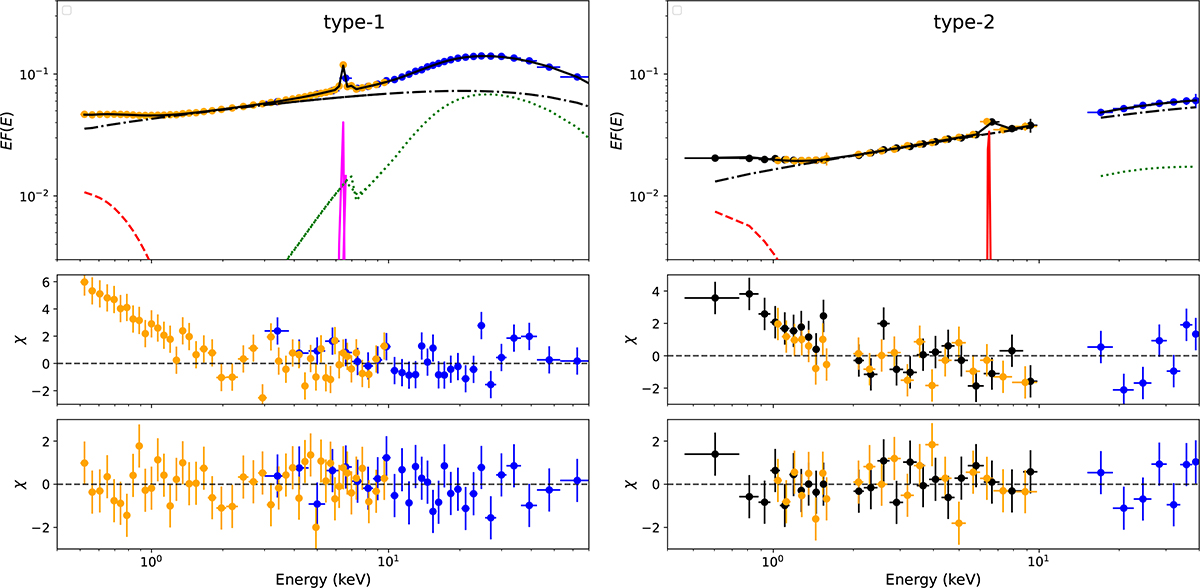
Fig. 1.
Download original image
Representative unfolded broadband X-ray spectra of NGC 1566 in type 1 and type 2 states (left and right panel, respectively). In the left panel, the orange and blue points represent the data from XMM-Newton/EPIC-PN and NuSTAR/FPMA observations, respectively. In the right panels, the black, orange, and blue points represent the Suzaku/XIS1, Suzaku/XIS0+XIS3, and Suzaku/HXD-PIN observations, respectively. The solid black, dot-dashed black, red dashed, solid magenta, and dotted green lines represent the total, continuum, soft excess, iron K-line, and reprocessed emission, respectively. The middle figures of each panel show the residual, while the data are fitted without the soft excess components. The bottom panels show the residuals for the full models.
Current usage metrics show cumulative count of Article Views (full-text article views including HTML views, PDF and ePub downloads, according to the available data) and Abstracts Views on Vision4Press platform.
Data correspond to usage on the plateform after 2015. The current usage metrics is available 48-96 hours after online publication and is updated daily on week days.
Initial download of the metrics may take a while.