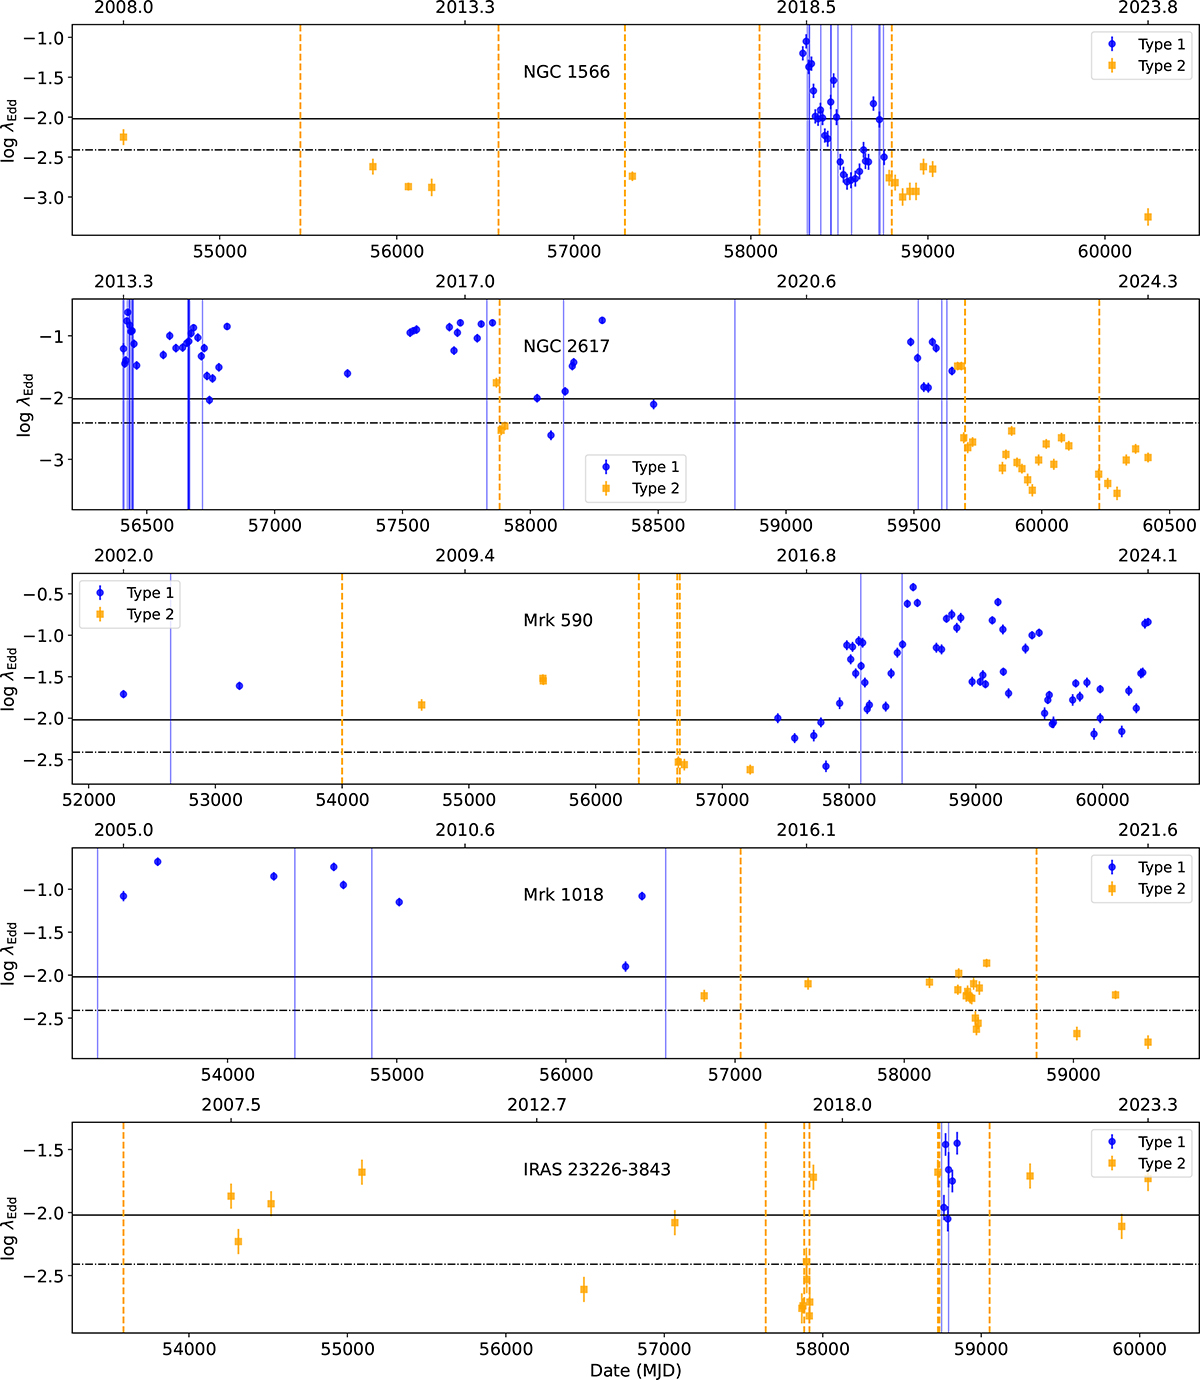
Fig. 2.
Download original image
Light curves of all five CSAGNs in different panels. The blue circles and orange diamonds mark the type 1 and type 2 states, respectively. The vertical lines in each panel represent the optical observations, where the solid blue and orange dot-dashed lines represent the type 1 and type 2 spectral states, respectively. The solid horizontal line in each panel represents the median of transition Eddington ratio ![]() at −2.01 ± 0.23 from Jana et al. (2025). The dot-dashed horizontal line represents the break-Eddington ratio (
at −2.01 ± 0.23 from Jana et al. (2025). The dot-dashed horizontal line represents the break-Eddington ratio (![]() .)
.)
Current usage metrics show cumulative count of Article Views (full-text article views including HTML views, PDF and ePub downloads, according to the available data) and Abstracts Views on Vision4Press platform.
Data correspond to usage on the plateform after 2015. The current usage metrics is available 48-96 hours after online publication and is updated daily on week days.
Initial download of the metrics may take a while.