Fig. 4.
Download original image
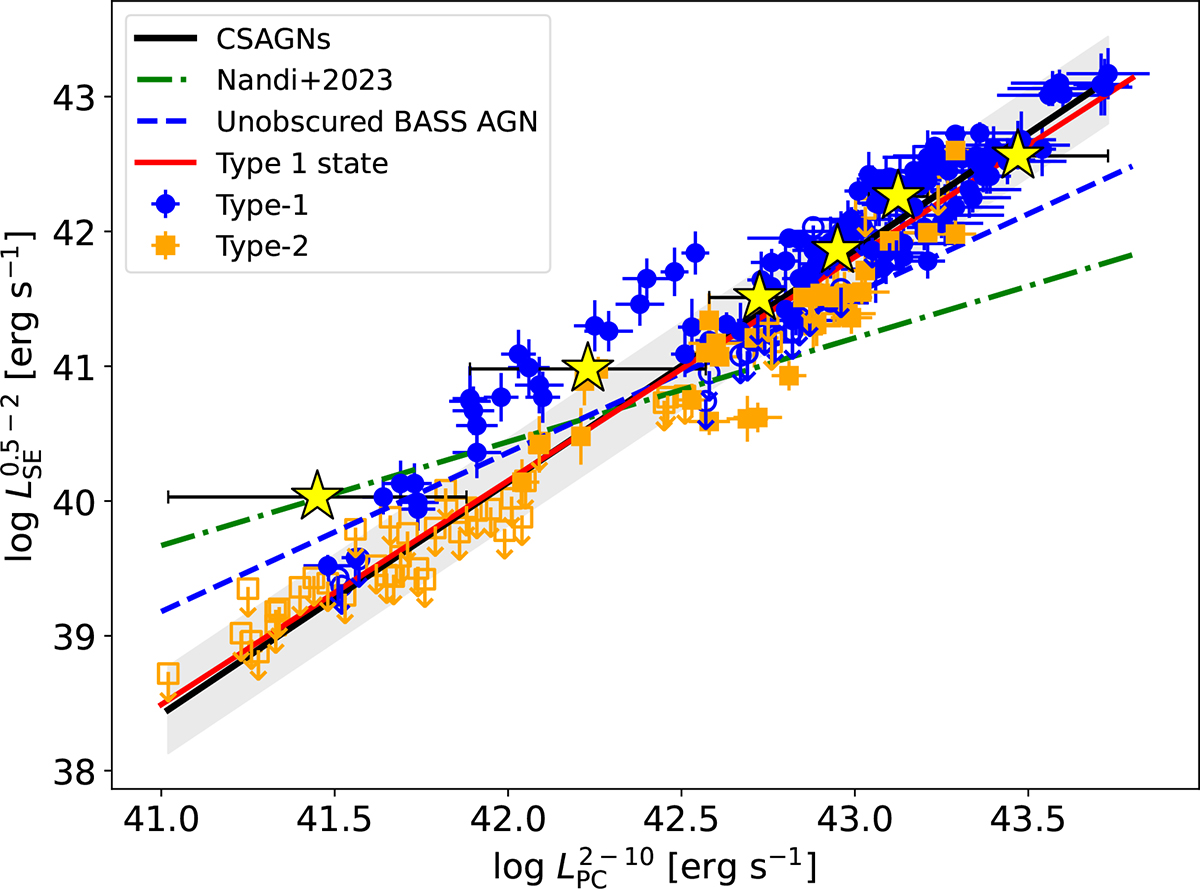
Variation of the soft excess luminosity (![]() ) in 0.5–2 keV energy range as a function of continuum luminosity (
) in 0.5–2 keV energy range as a function of continuum luminosity (![]() ) in 2–10 keV flux. The filled blue circles and orange squares represent the data from the type 1 and type 2 states, respectively. The open blue circles and orange squares represent the upper limit from the type 1 and type 2 state, respectively. The yellow stars represent the binned data points. The solid black line represents the linear best fit. The gray regions mark the 1σ scatter. The red solid line represents the linear best fit, considering only the type 1 state. The green dash-dotted and blue dashed lines represent the linear best fit for bare AGNs from Nandi et al. (2023) and unobscured BASS AGNs from Jana et al. (in prep.).
) in 2–10 keV flux. The filled blue circles and orange squares represent the data from the type 1 and type 2 states, respectively. The open blue circles and orange squares represent the upper limit from the type 1 and type 2 state, respectively. The yellow stars represent the binned data points. The solid black line represents the linear best fit. The gray regions mark the 1σ scatter. The red solid line represents the linear best fit, considering only the type 1 state. The green dash-dotted and blue dashed lines represent the linear best fit for bare AGNs from Nandi et al. (2023) and unobscured BASS AGNs from Jana et al. (in prep.).
Current usage metrics show cumulative count of Article Views (full-text article views including HTML views, PDF and ePub downloads, according to the available data) and Abstracts Views on Vision4Press platform.
Data correspond to usage on the plateform after 2015. The current usage metrics is available 48-96 hours after online publication and is updated daily on week days.
Initial download of the metrics may take a while.