Fig. 5.
Download original image
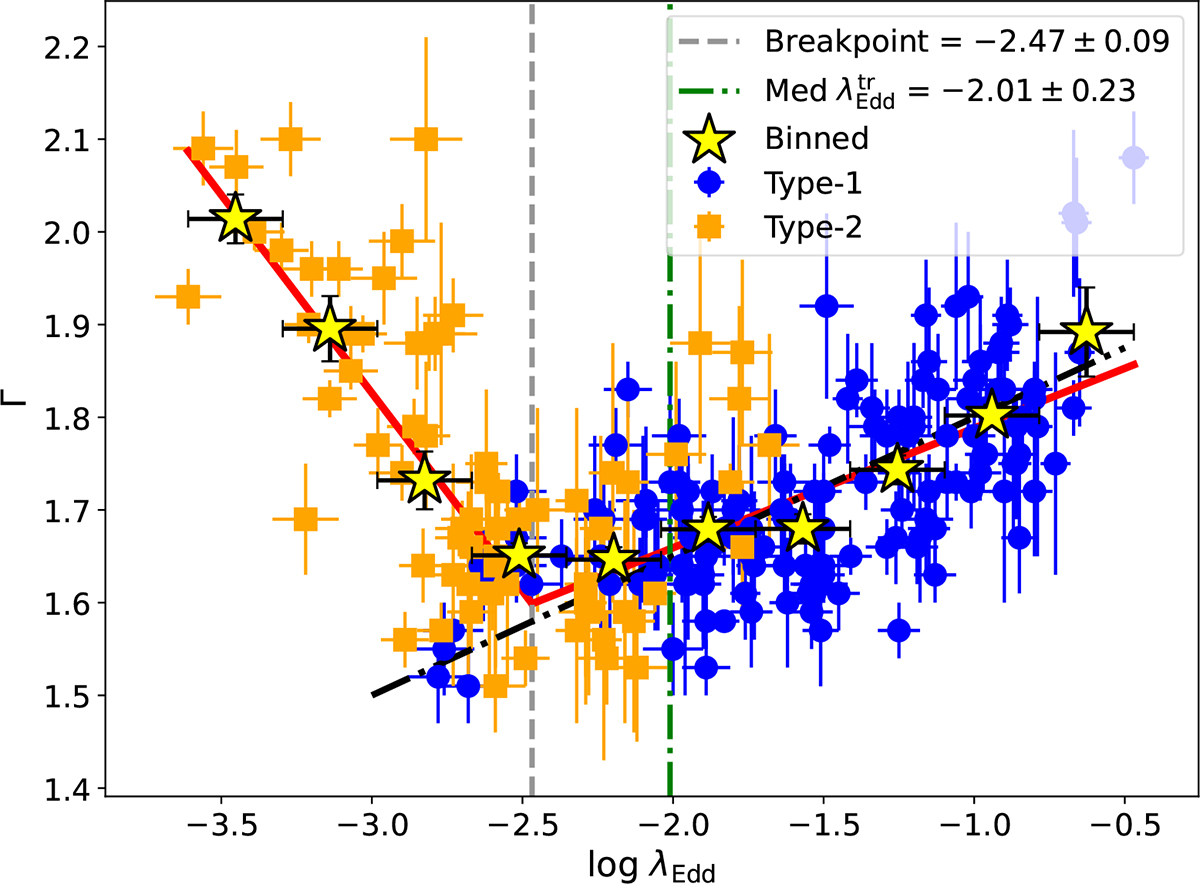
Relation between Γ and λEdd. The blue circles and orange squares represent the data from the type 1 and type 2 states, respectively. The yellow stars represent the binned data points. The red lines represent the linear best fit of the dataset with a break at log λEdd = −2.47 ± 0.09. The break-point is marked by the vertical gray dashed line. The vertical green dash-dotted line represent the median of the transition Eddington ratio (![]() ) for CSAGNs, which is
) for CSAGNs, which is ![]() . The
. The ![]() is taken from Jana et al. (2025). The black dash-dotted line represents the Γ − λEdd relation of BASS AGNs, adopted from Trakhtenbrot et al. (2017).
is taken from Jana et al. (2025). The black dash-dotted line represents the Γ − λEdd relation of BASS AGNs, adopted from Trakhtenbrot et al. (2017).
Current usage metrics show cumulative count of Article Views (full-text article views including HTML views, PDF and ePub downloads, according to the available data) and Abstracts Views on Vision4Press platform.
Data correspond to usage on the plateform after 2015. The current usage metrics is available 48-96 hours after online publication and is updated daily on week days.
Initial download of the metrics may take a while.