Fig. 6.
Download original image
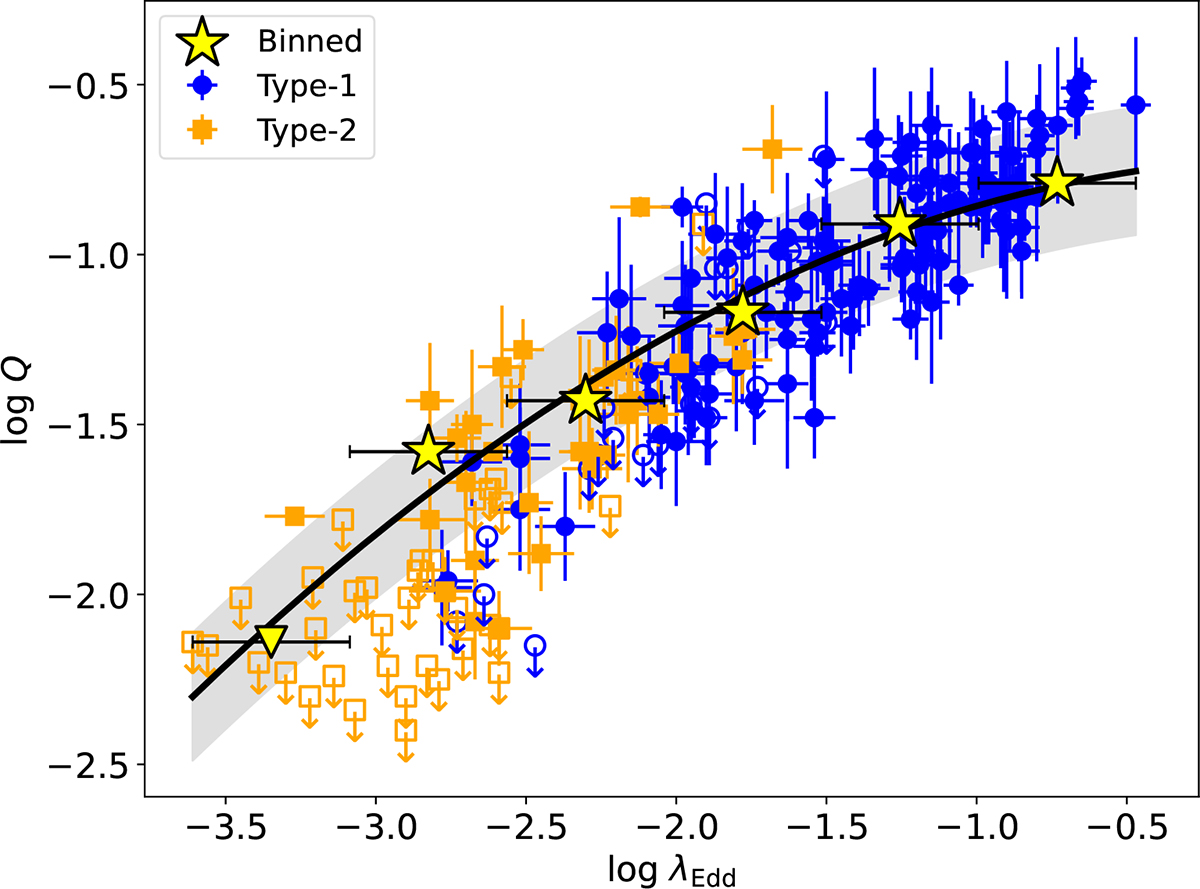
Soft excess strength (Q) as a function of Eddington ratio (λEdd). The filled blue circles and orange squares represent the data from type 1 and type 2 states, respectively, while the open blue circles and orange squares represent the upper limits from type 1 and type 2 state, respectively. The yellow stars represent the binned data points, while the yellow down triangle represents the upper limit. The black dashed line represents the best fit. The gray region marks the 1σ scatter.
Current usage metrics show cumulative count of Article Views (full-text article views including HTML views, PDF and ePub downloads, according to the available data) and Abstracts Views on Vision4Press platform.
Data correspond to usage on the plateform after 2015. The current usage metrics is available 48-96 hours after online publication and is updated daily on week days.
Initial download of the metrics may take a while.