Open Access
Fig. 1
Download original image
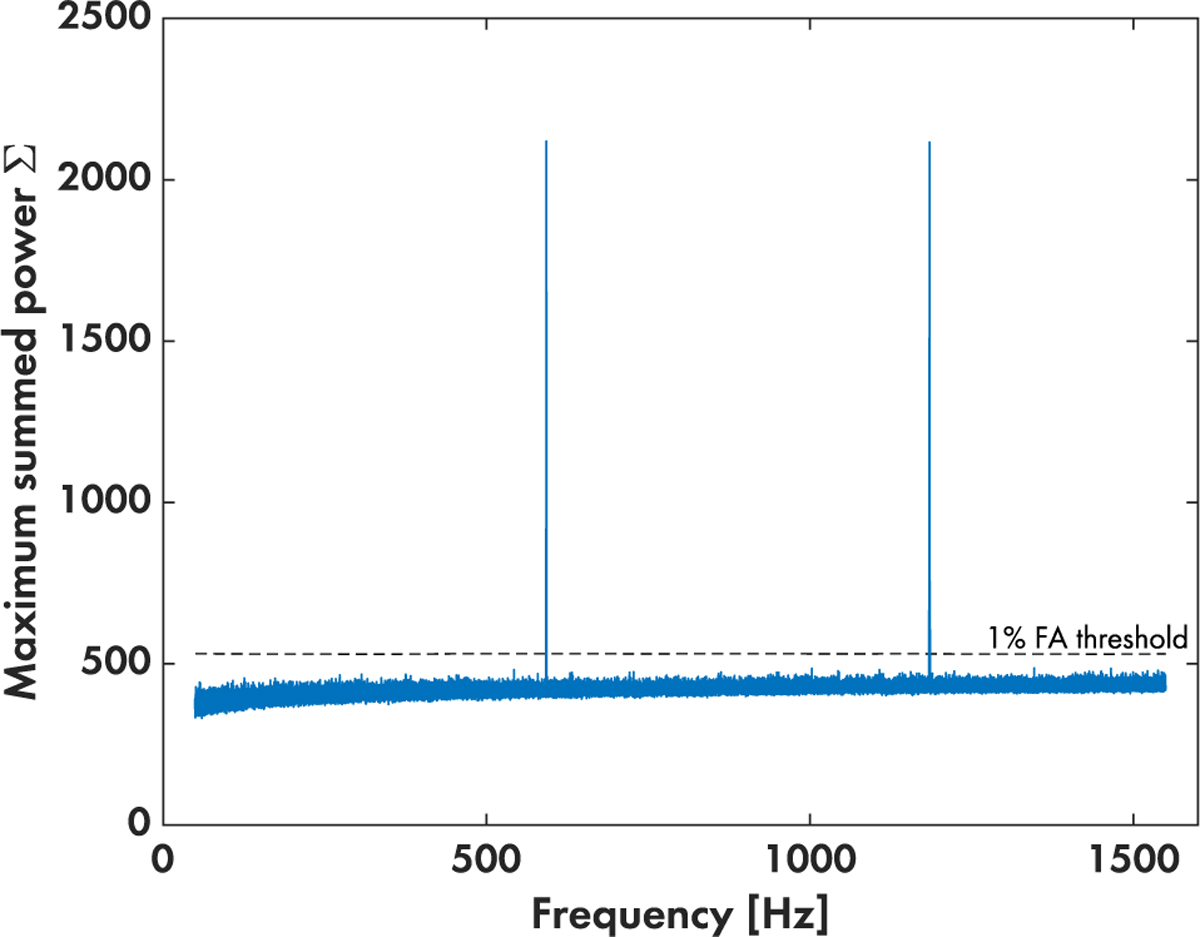
Maximum values of the summed power Σ, regardless of the corresponding orbital parameter combination, in the 50-1550 Hz frequency range, on a SiFAP2 observation of PSR J1023+0038. The dashed black line represents the 1% false-alarm threshold, which instead is calculated for all the combinations explored.
Current usage metrics show cumulative count of Article Views (full-text article views including HTML views, PDF and ePub downloads, according to the available data) and Abstracts Views on Vision4Press platform.
Data correspond to usage on the plateform after 2015. The current usage metrics is available 48-96 hours after online publication and is updated daily on week days.
Initial download of the metrics may take a while.