Open Access
Fig. A.1
Download original image
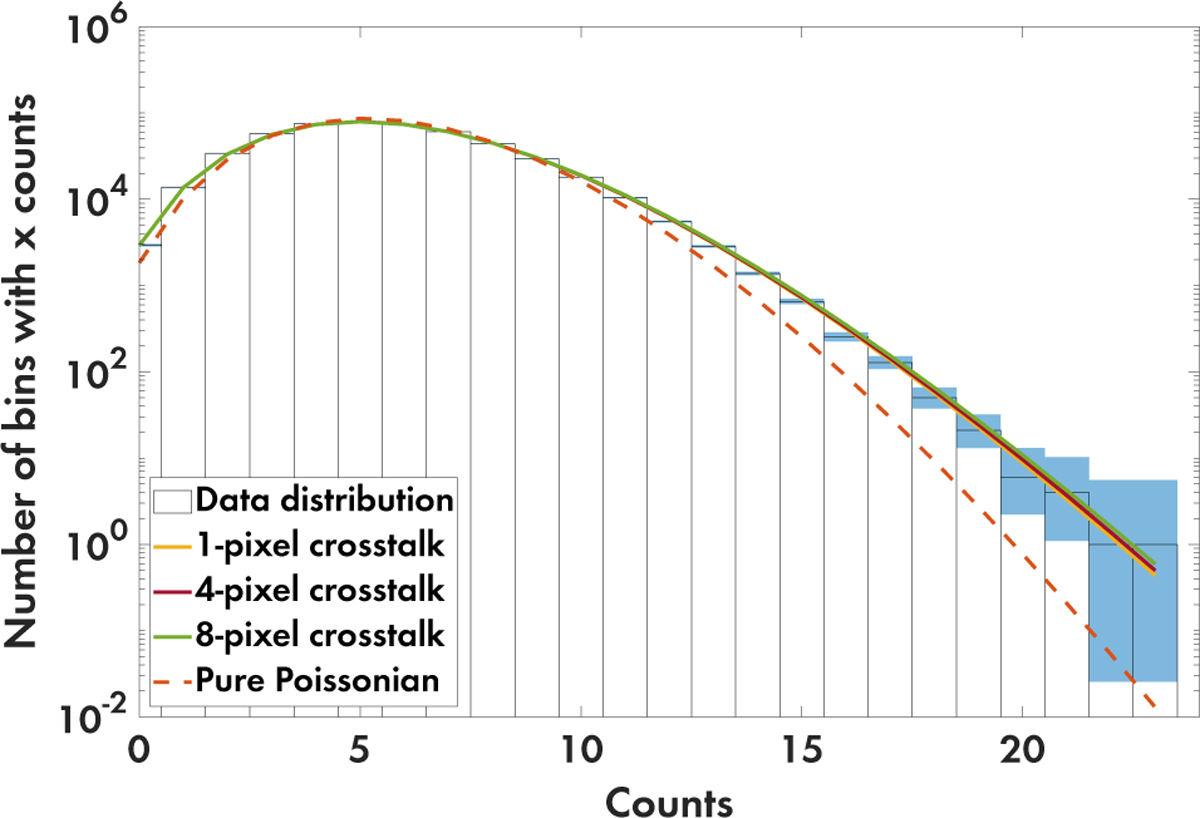
Counts distribution from a 128-s SiFAP2 lightcurve binned at 2.5 × 10⁻⁴ s (histogram), with binomial uncertainties (light blue area, 95% c.l.), compared with the expected distributions from pure Poisso-nian noise (orange dashed line), and GP noise arising from 1-, 4-, and 8-pixel crosstalk (solid lines).
Current usage metrics show cumulative count of Article Views (full-text article views including HTML views, PDF and ePub downloads, according to the available data) and Abstracts Views on Vision4Press platform.
Data correspond to usage on the plateform after 2015. The current usage metrics is available 48-96 hours after online publication and is updated daily on week days.
Initial download of the metrics may take a while.