Fig. C.1
Download original image
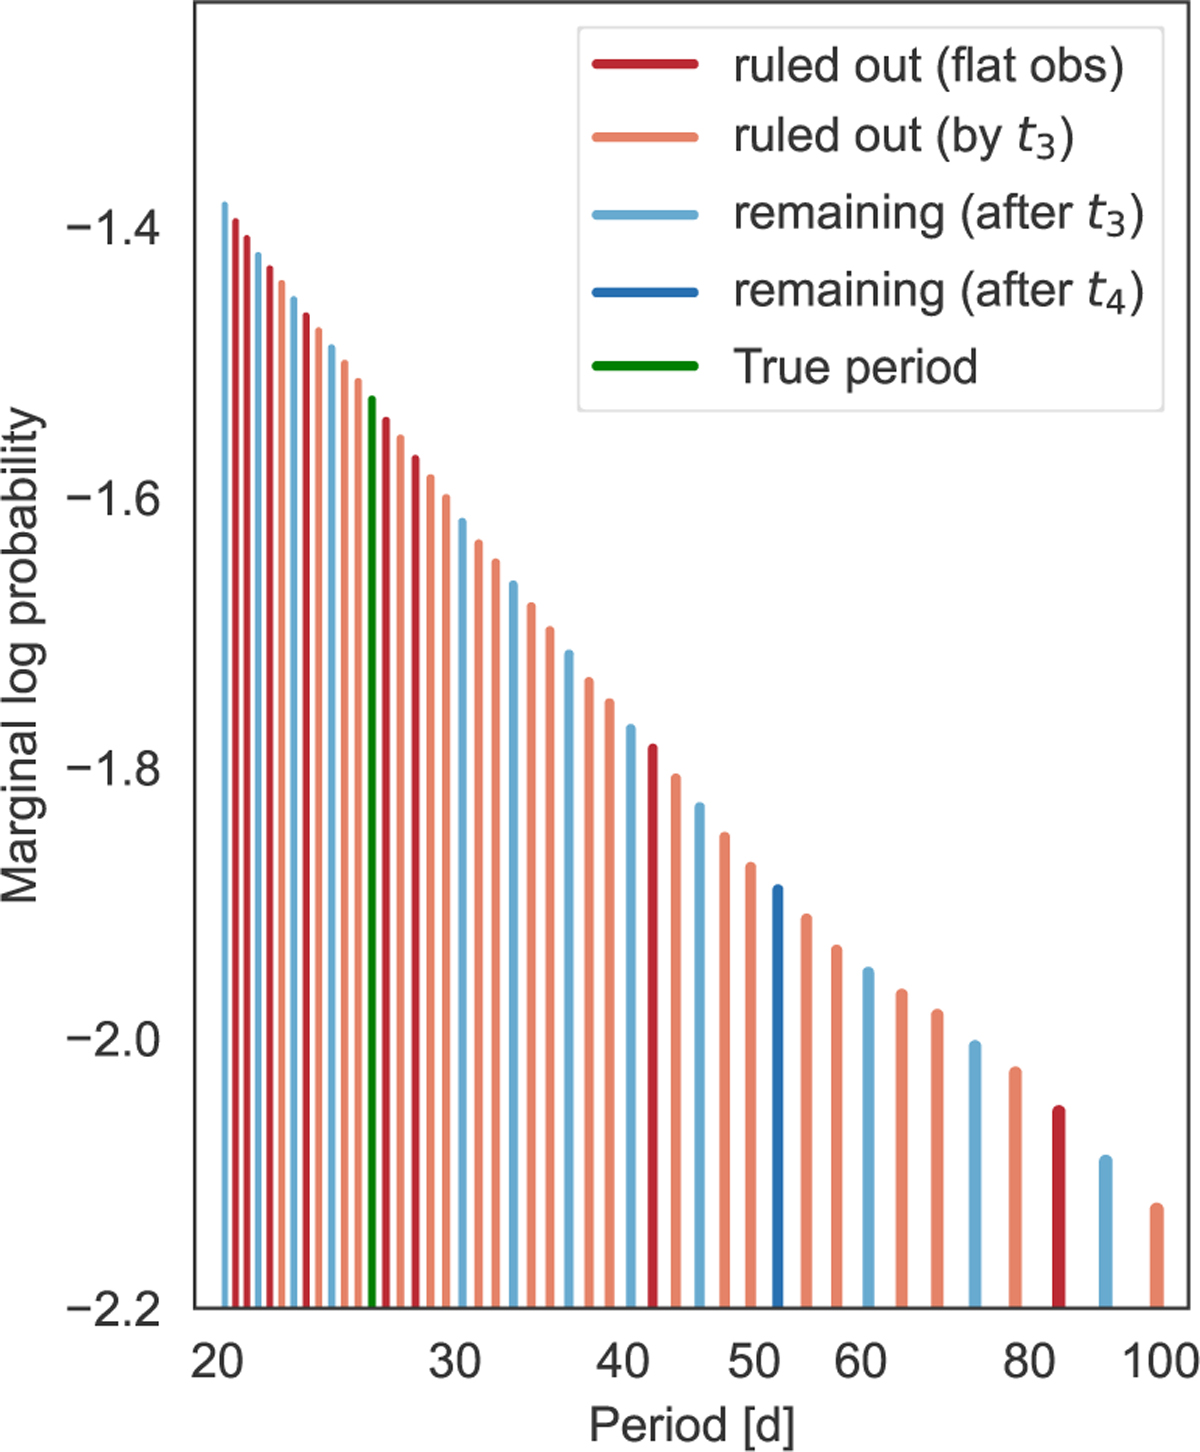
Log probabilities for individual aliases below 100 d from MonoTools analysis. Dark red bars show aliases ruled out by CHEOPS non-detections. Light red bars show aliases ruled out by the initial CHEOPS transit (at t3 = 2460254.82; also identical to the alias constraints from the additional TESS transit at t5 = 2460619.47). Light blue bars show potential aliases after the third transit. The dark blue bar (Pb ∼ 52 d) shows the only other remaining alias after the second CHEOPS transit detection (at t4 = 2460306.92), and the green bar shows the true period confirmed by the third CHEOPS transit observation (at t6 = 2460645.53). Only solutions with P < 100 d are shown.
Current usage metrics show cumulative count of Article Views (full-text article views including HTML views, PDF and ePub downloads, according to the available data) and Abstracts Views on Vision4Press platform.
Data correspond to usage on the plateform after 2015. The current usage metrics is available 48-96 hours after online publication and is updated daily on week days.
Initial download of the metrics may take a while.