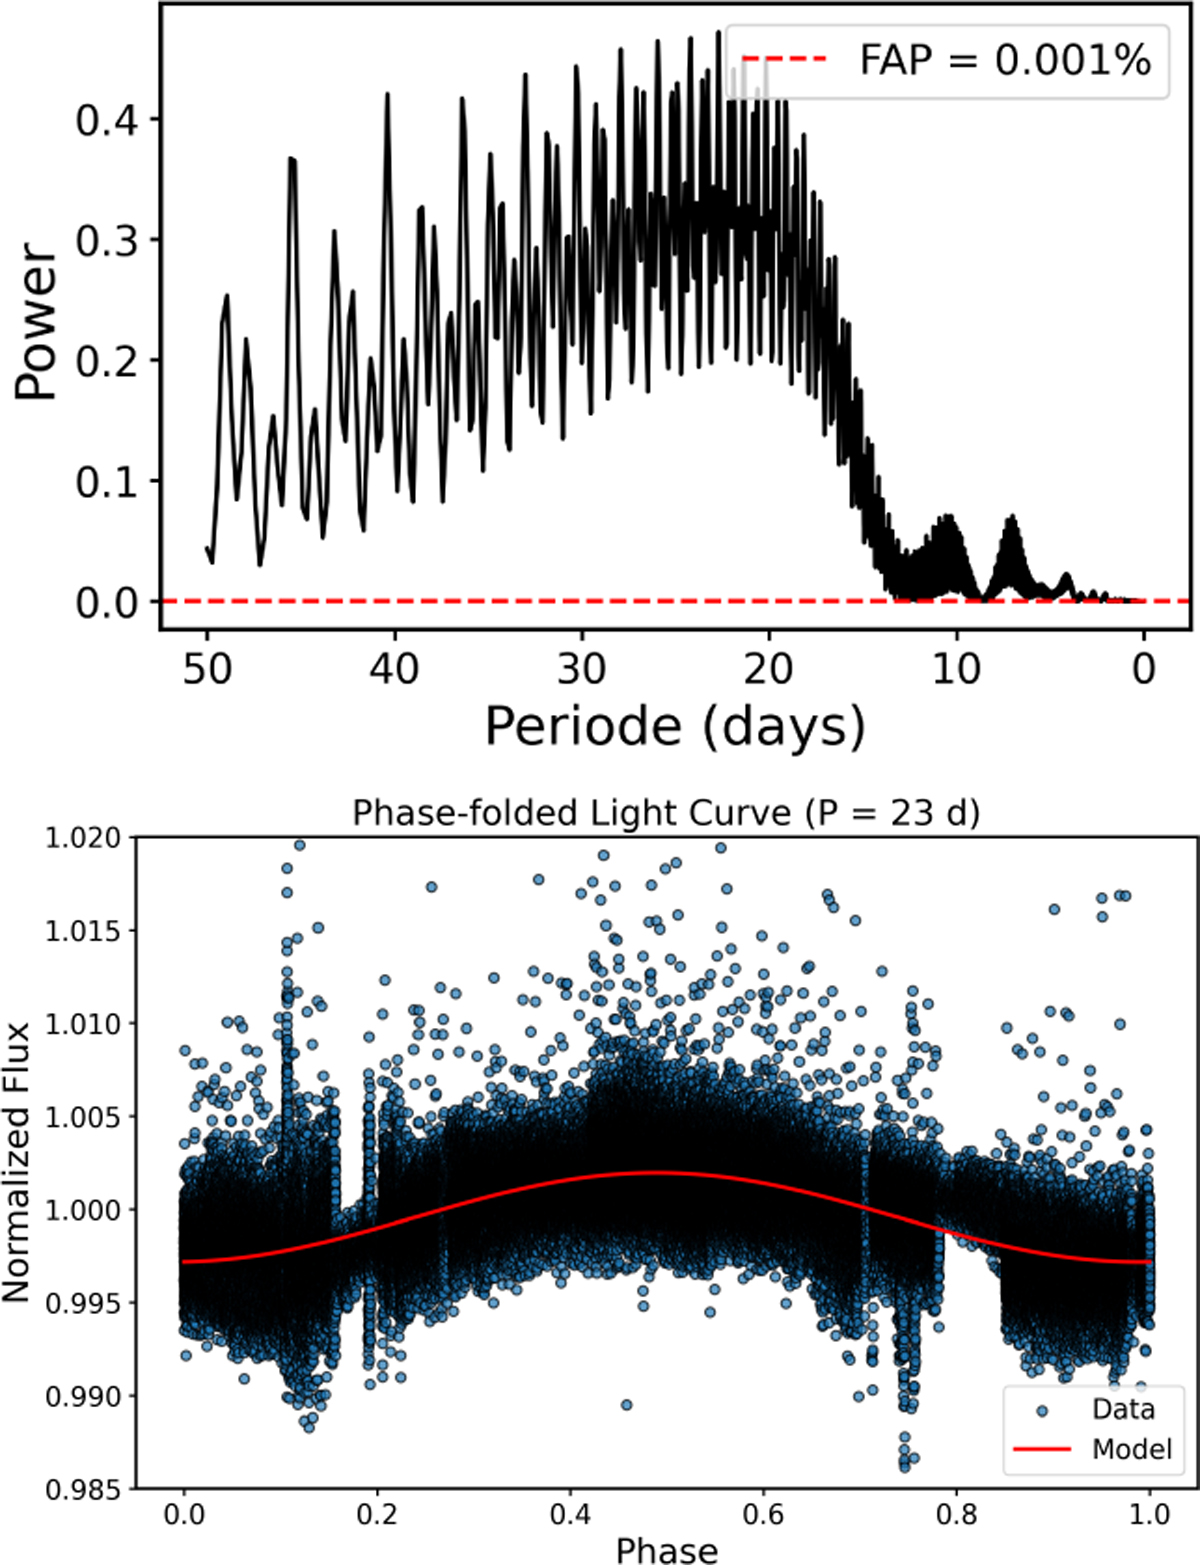
Fig. F.1
Download original image
Rotation period analysis from the SAP TESS light curve, after masking transits of TOI-6041 b. Top: Lomb-Scargle periodogram showing a broad, significant peak between 20–30 d, under the 0.001% FAP. Bottom: Light curve phase-folded on the best-fit period (∼23 d), with the model overplotted in red. This analysis was performed using the <mono>Astropy</mono> library.
Current usage metrics show cumulative count of Article Views (full-text article views including HTML views, PDF and ePub downloads, according to the available data) and Abstracts Views on Vision4Press platform.
Data correspond to usage on the plateform after 2015. The current usage metrics is available 48-96 hours after online publication and is updated daily on week days.
Initial download of the metrics may take a while.