Fig. H.2
Download original image
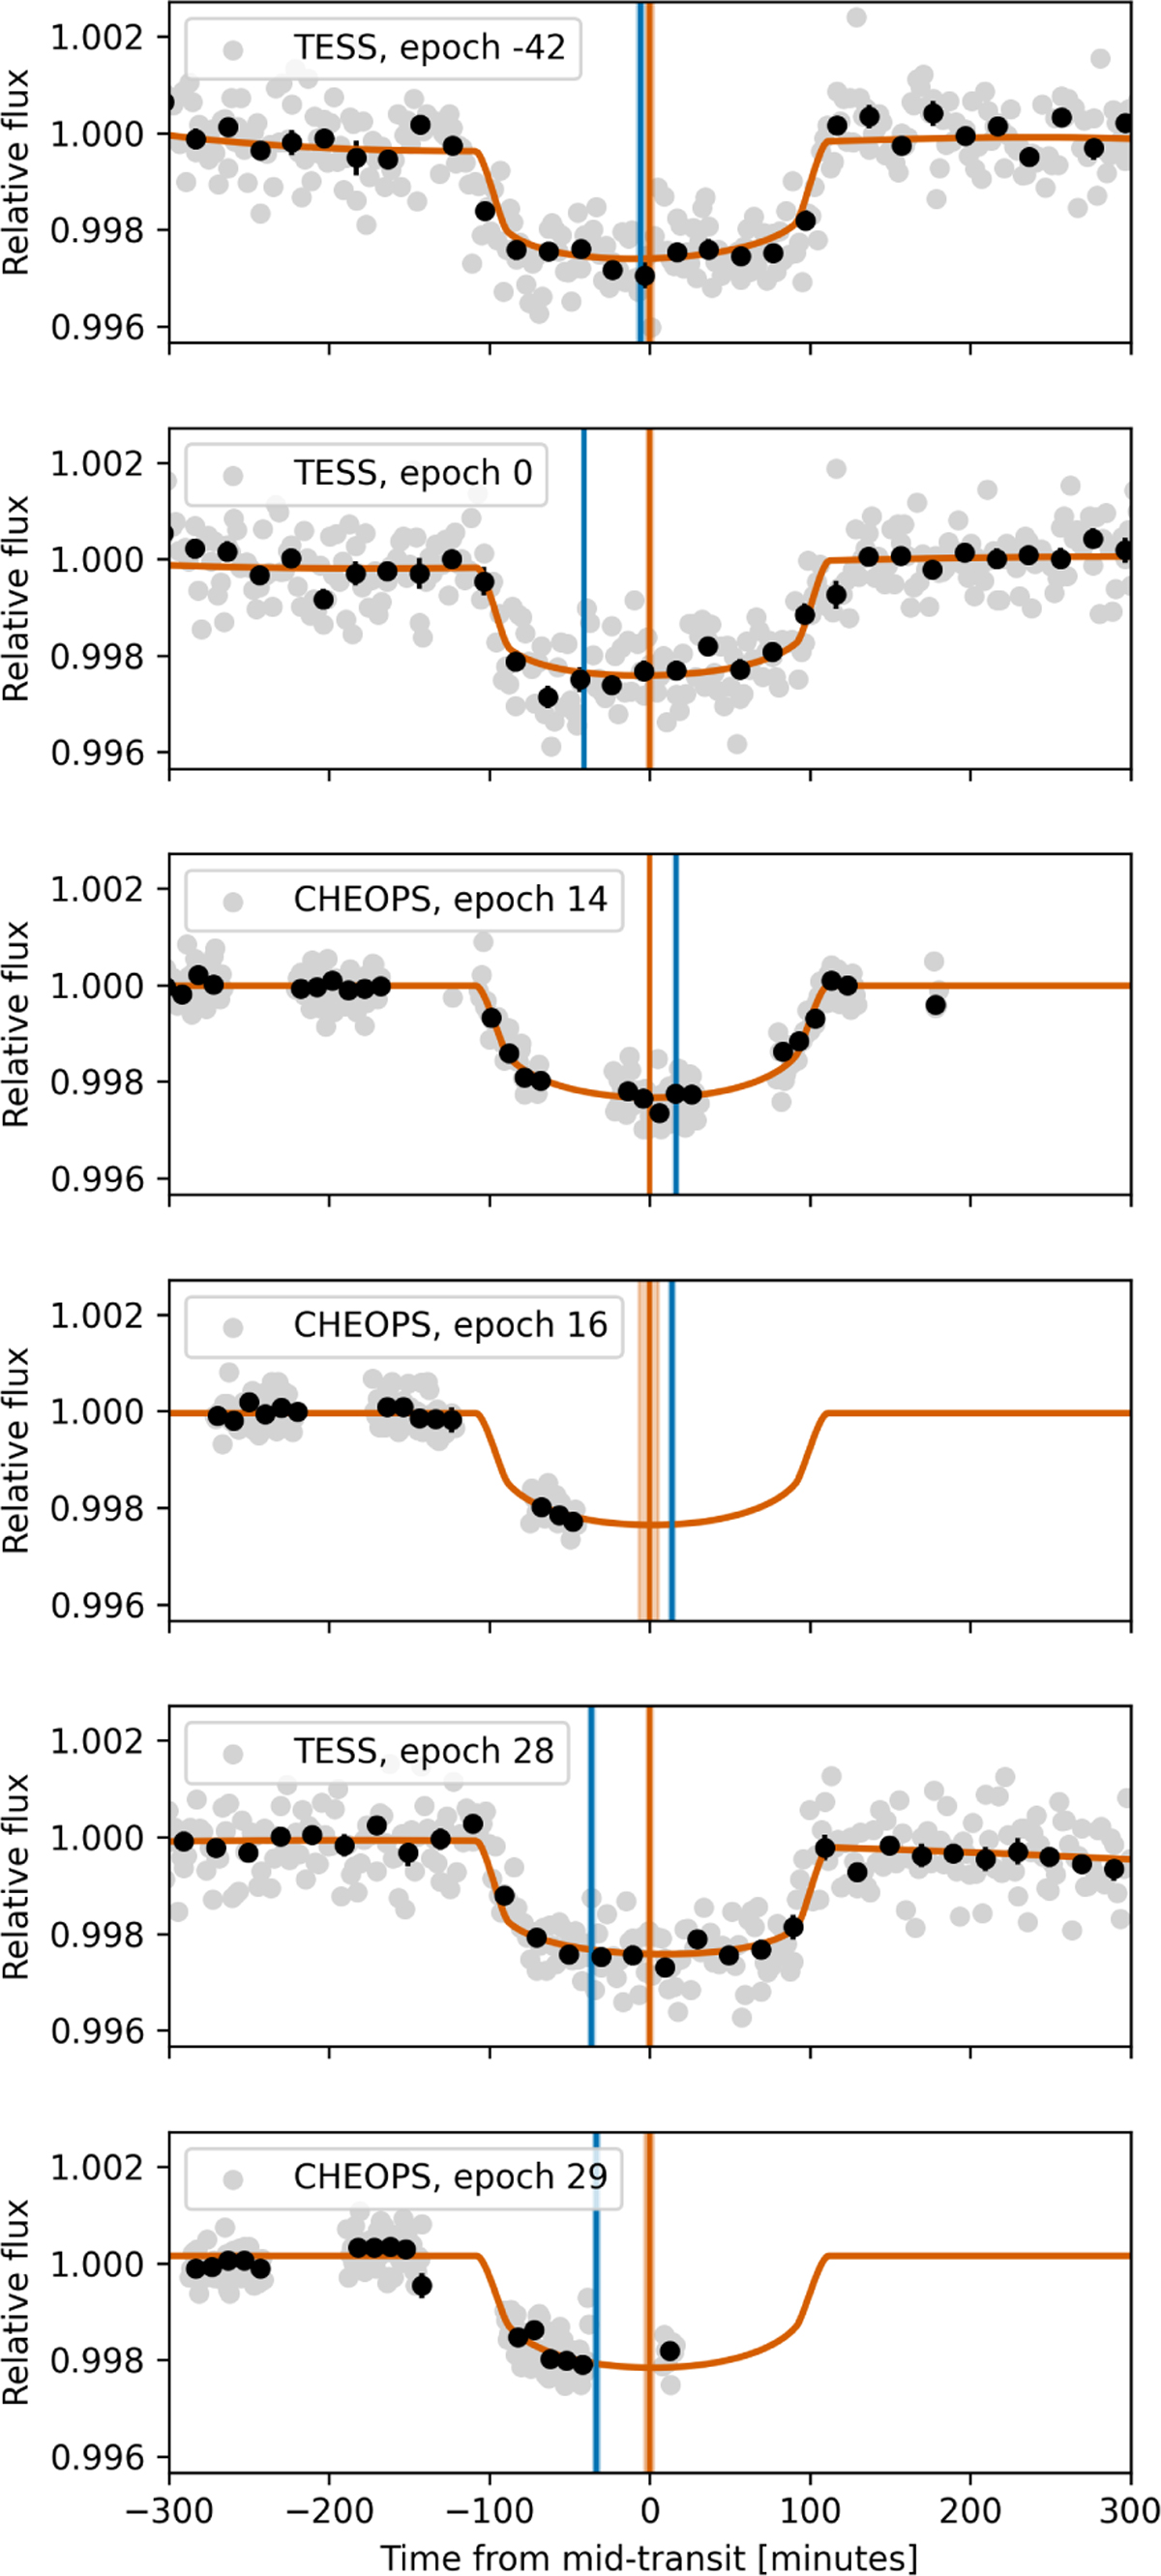
TOI-6041 TESS and CHEOPS photometric data, overplotted by the joint modeling including the TTV fit using the <mono>EXOFASTv2</mono>. The data points are plotted in gray, with the black points representing the binned data: 20-minute bins for the TESS data and 9-minute bins for the CHEOPS data. The best-fit transit models are displayed in orange. Vertical blue lines show the expected linear mid-transit times, and vertical orange lines mark the measured mid-transit times; both include their respective 1σ error bars. The transit epoch is labeled in the top-left corner of each plot.
Current usage metrics show cumulative count of Article Views (full-text article views including HTML views, PDF and ePub downloads, according to the available data) and Abstracts Views on Vision4Press platform.
Data correspond to usage on the plateform after 2015. The current usage metrics is available 48-96 hours after online publication and is updated daily on week days.
Initial download of the metrics may take a while.