Fig. 2
Download original image
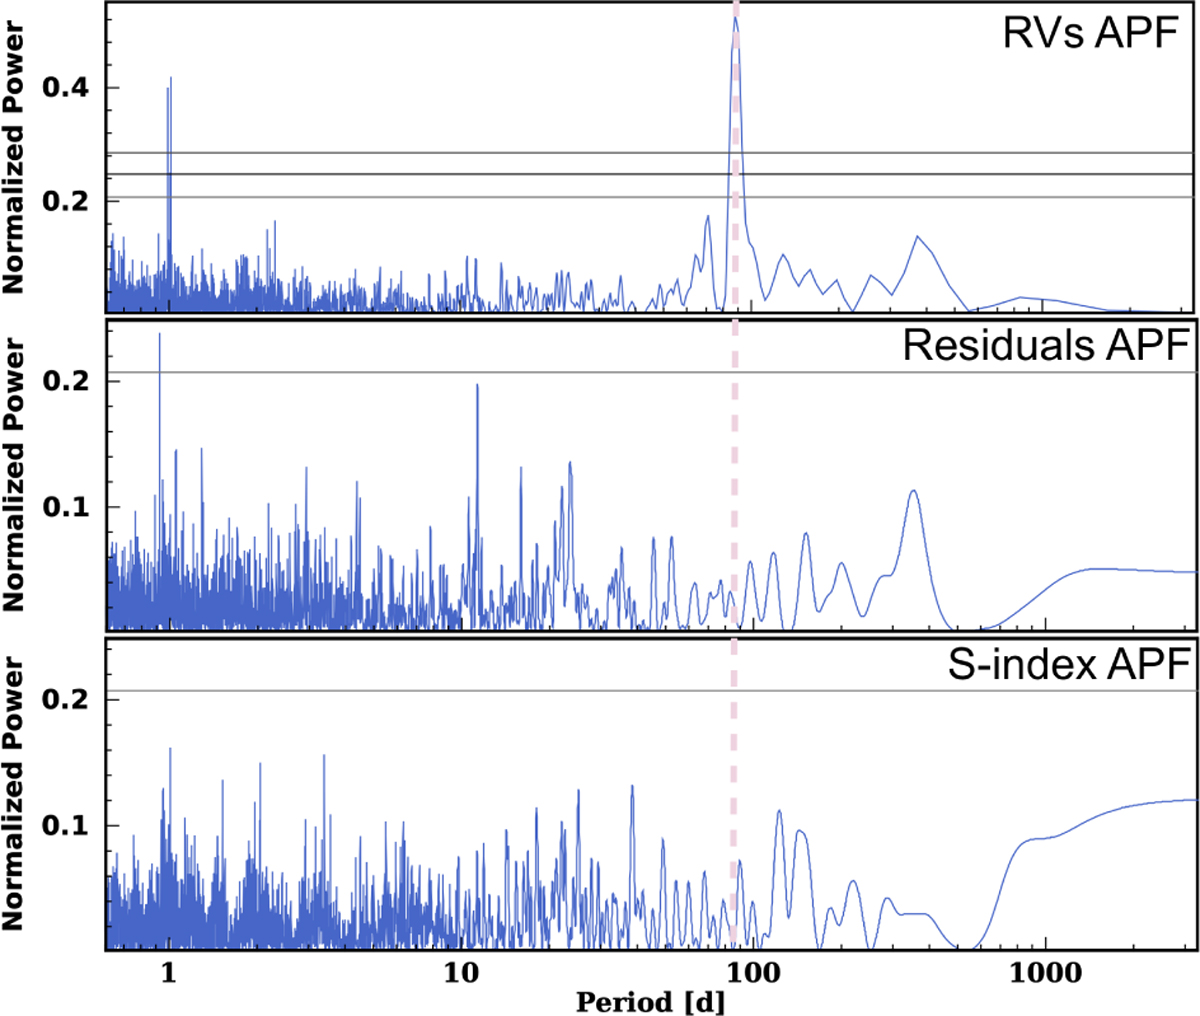
Periodograms of RV and S-index derived from APF data for TOI-6041. From top to bottom: APF RVs, residuals of the RVs after a Keplerian fit to the 88 d signal, and the S-index activity indicator. The vertical pink line marks the planet candidate with a period of 88 d, which shows no corresponding signal in the S-index periodogram. The horizontal lines indicate false alarm probability (FAP; Baluev 2008) thresholds of 0.1%, 1%, and 10%, respectively, from top to bottom.
Current usage metrics show cumulative count of Article Views (full-text article views including HTML views, PDF and ePub downloads, according to the available data) and Abstracts Views on Vision4Press platform.
Data correspond to usage on the plateform after 2015. The current usage metrics is available 48-96 hours after online publication and is updated daily on week days.
Initial download of the metrics may take a while.