Open Access
Fig. 1
Download original image
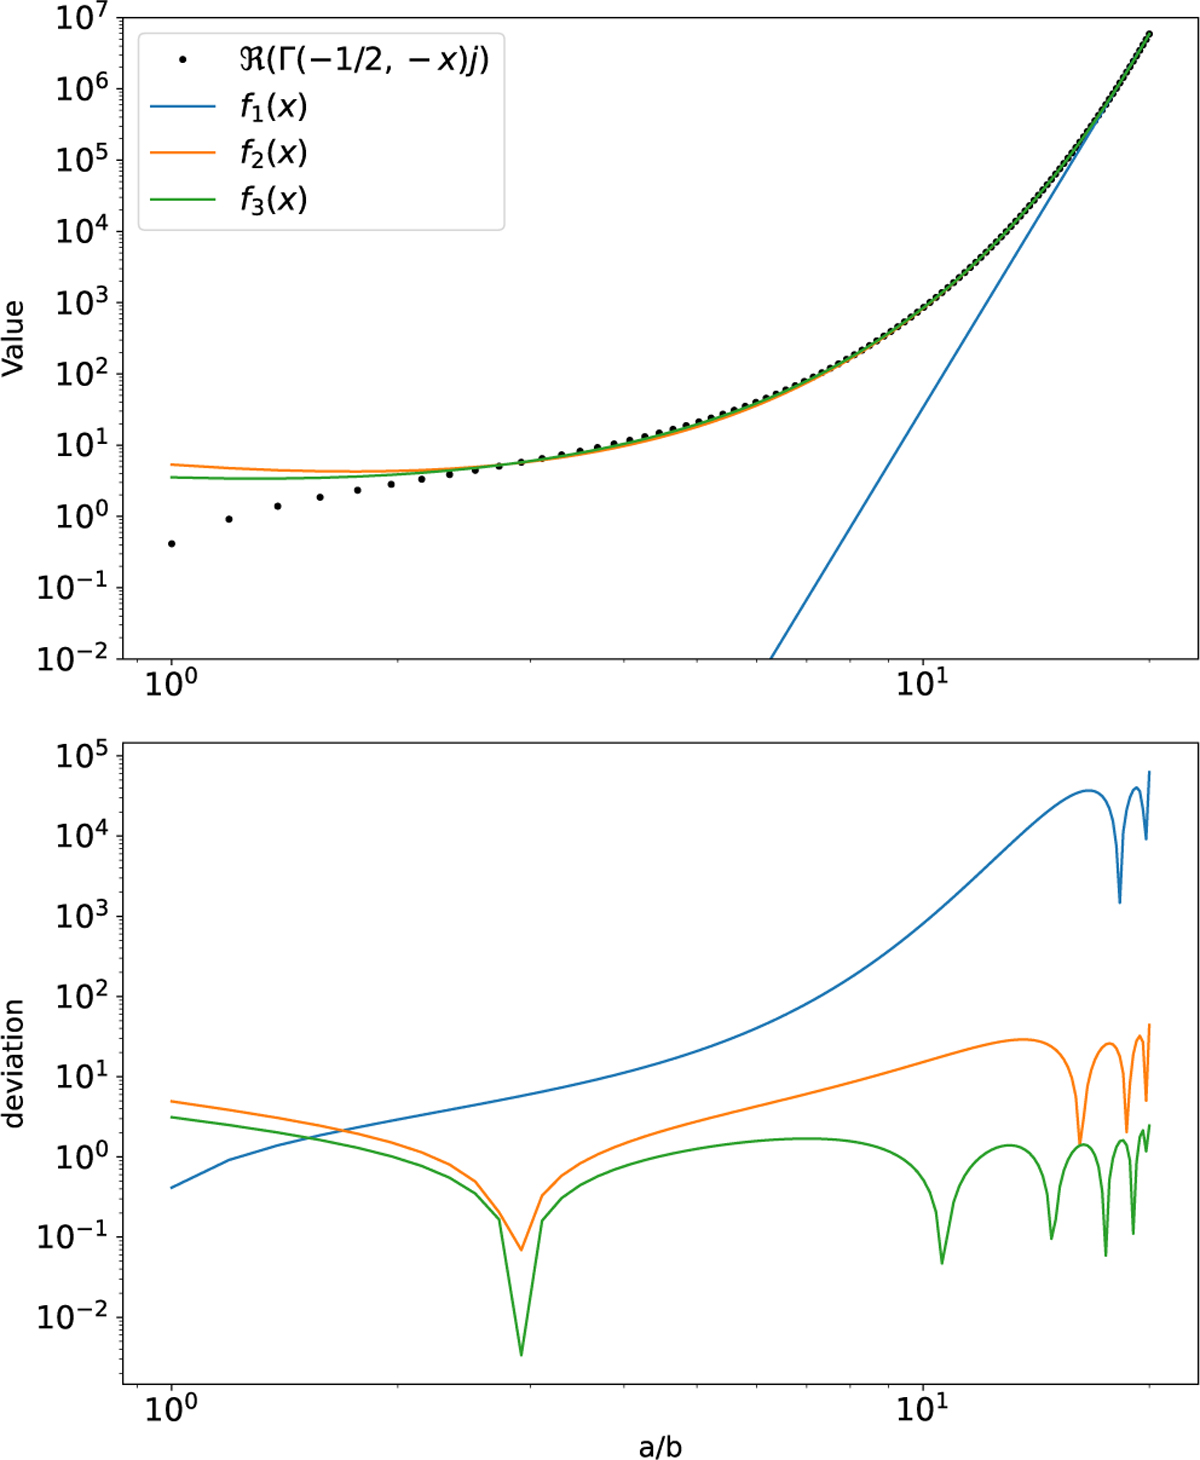
Upper panel: real part of the incomplete gamma function Γ(−1/2, −a/b)i (black points) with fitting with f1(x) (blue line), f2(x) (orange line), and f3(x) (green line). Lower panel: deviations from the incomplete gamma function.
Current usage metrics show cumulative count of Article Views (full-text article views including HTML views, PDF and ePub downloads, according to the available data) and Abstracts Views on Vision4Press platform.
Data correspond to usage on the plateform after 2015. The current usage metrics is available 48-96 hours after online publication and is updated daily on week days.
Initial download of the metrics may take a while.