Open Access
Fig. 4
Download original image
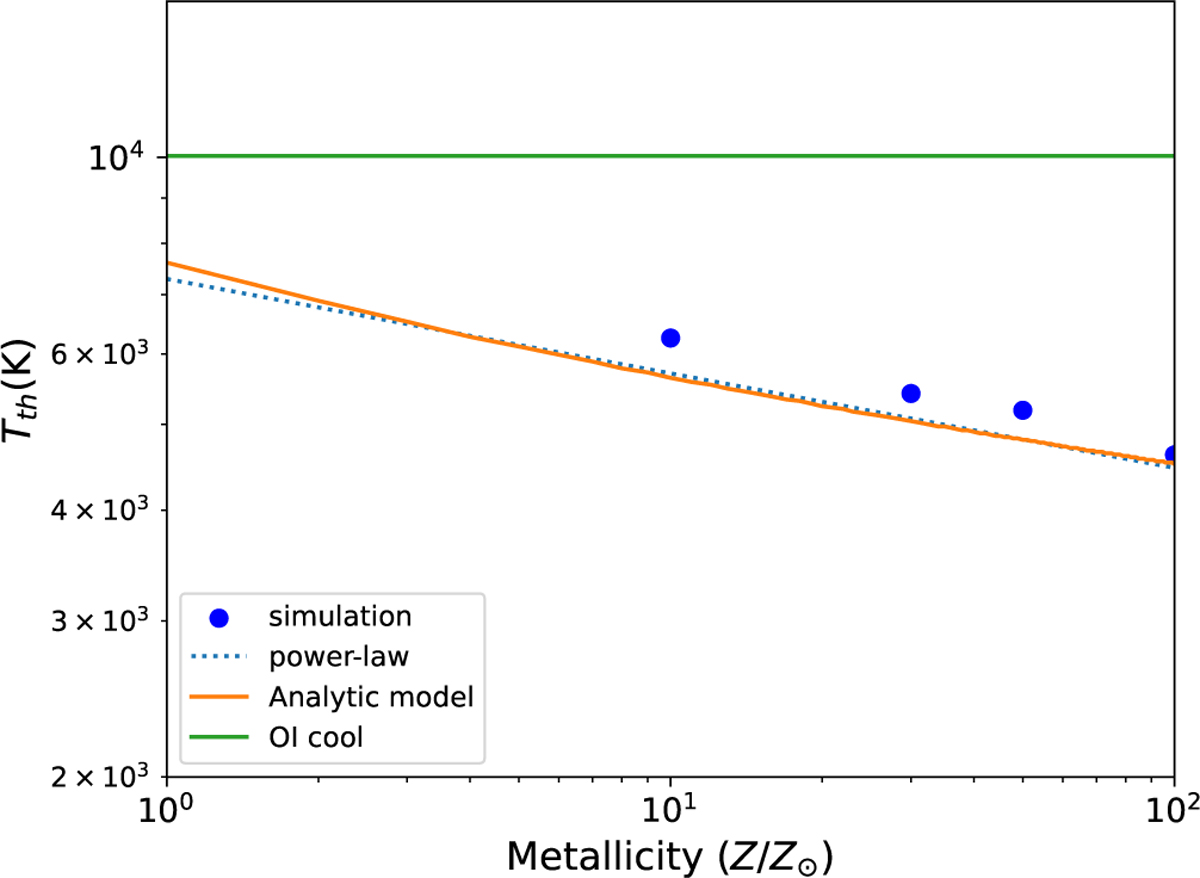
Thermospheric balance gas temperatures as a function of metal-licity. The temperature from Eq. (26) - with the orange and green curves representing Mg and OI cooling - and the gas temperature at the sonic point from simulations (dots) are shown. The power-law fit of Eq. (27) is also shown as a dotted curve.
Current usage metrics show cumulative count of Article Views (full-text article views including HTML views, PDF and ePub downloads, according to the available data) and Abstracts Views on Vision4Press platform.
Data correspond to usage on the plateform after 2015. The current usage metrics is available 48-96 hours after online publication and is updated daily on week days.
Initial download of the metrics may take a while.