Open Access
Fig. 5
Download original image
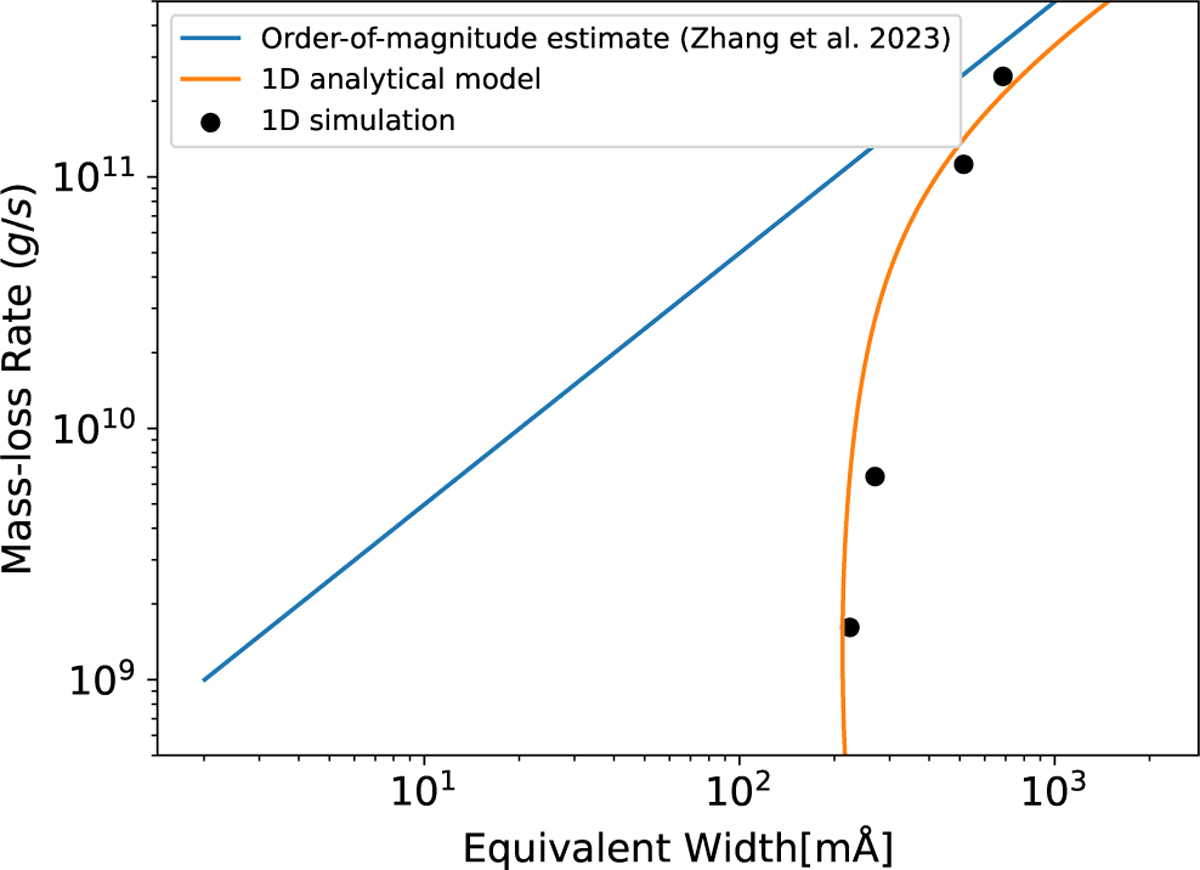
Relationship between the equivalent width and the mass-loss rate. The blue curve represents the order-of-magnitude estimate by Zhang et al. (2023). The orange curve represents our 1D analytical model. The results of our 1D simulations with different metallicity (Z = 0,1,10,30Z⊙) are shown as black dots.
Current usage metrics show cumulative count of Article Views (full-text article views including HTML views, PDF and ePub downloads, according to the available data) and Abstracts Views on Vision4Press platform.
Data correspond to usage on the plateform after 2015. The current usage metrics is available 48-96 hours after online publication and is updated daily on week days.
Initial download of the metrics may take a while.