Open Access
Fig. 13
Download original image
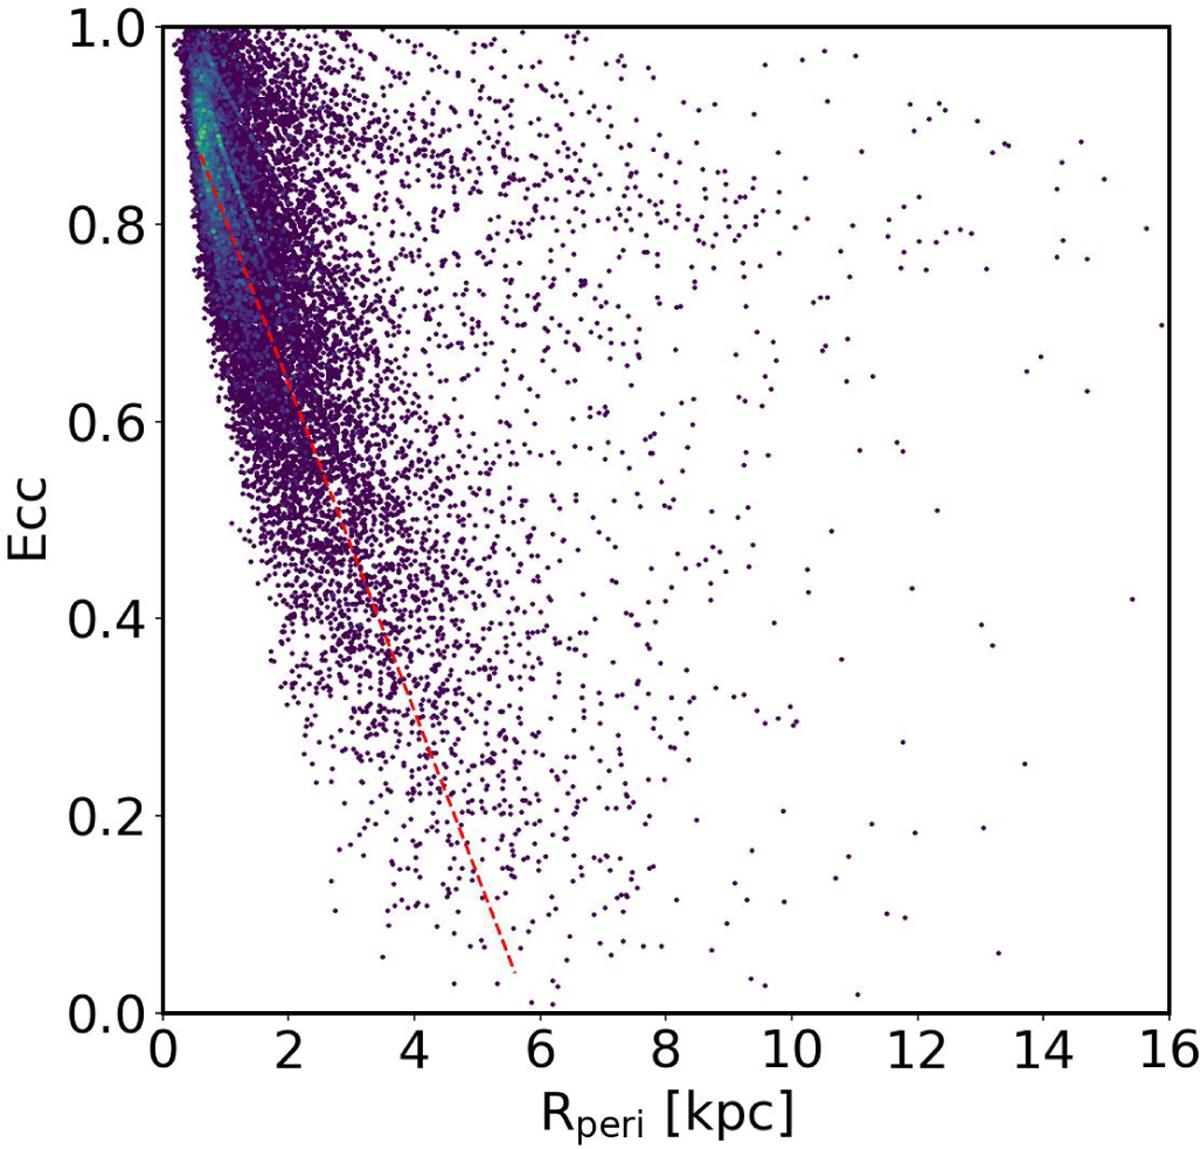
Density distribution of the retrograde stars of the sample in the Rperi–ecc space. The dashed red line sits on top of the first resonant locus identified in Fig. 1 and is clearly different from the quasi-parallel line of the retrograde locus visible on its right.
Current usage metrics show cumulative count of Article Views (full-text article views including HTML views, PDF and ePub downloads, according to the available data) and Abstracts Views on Vision4Press platform.
Data correspond to usage on the plateform after 2015. The current usage metrics is available 48-96 hours after online publication and is updated daily on week days.
Initial download of the metrics may take a while.