Open Access
Fig. 5
Download original image
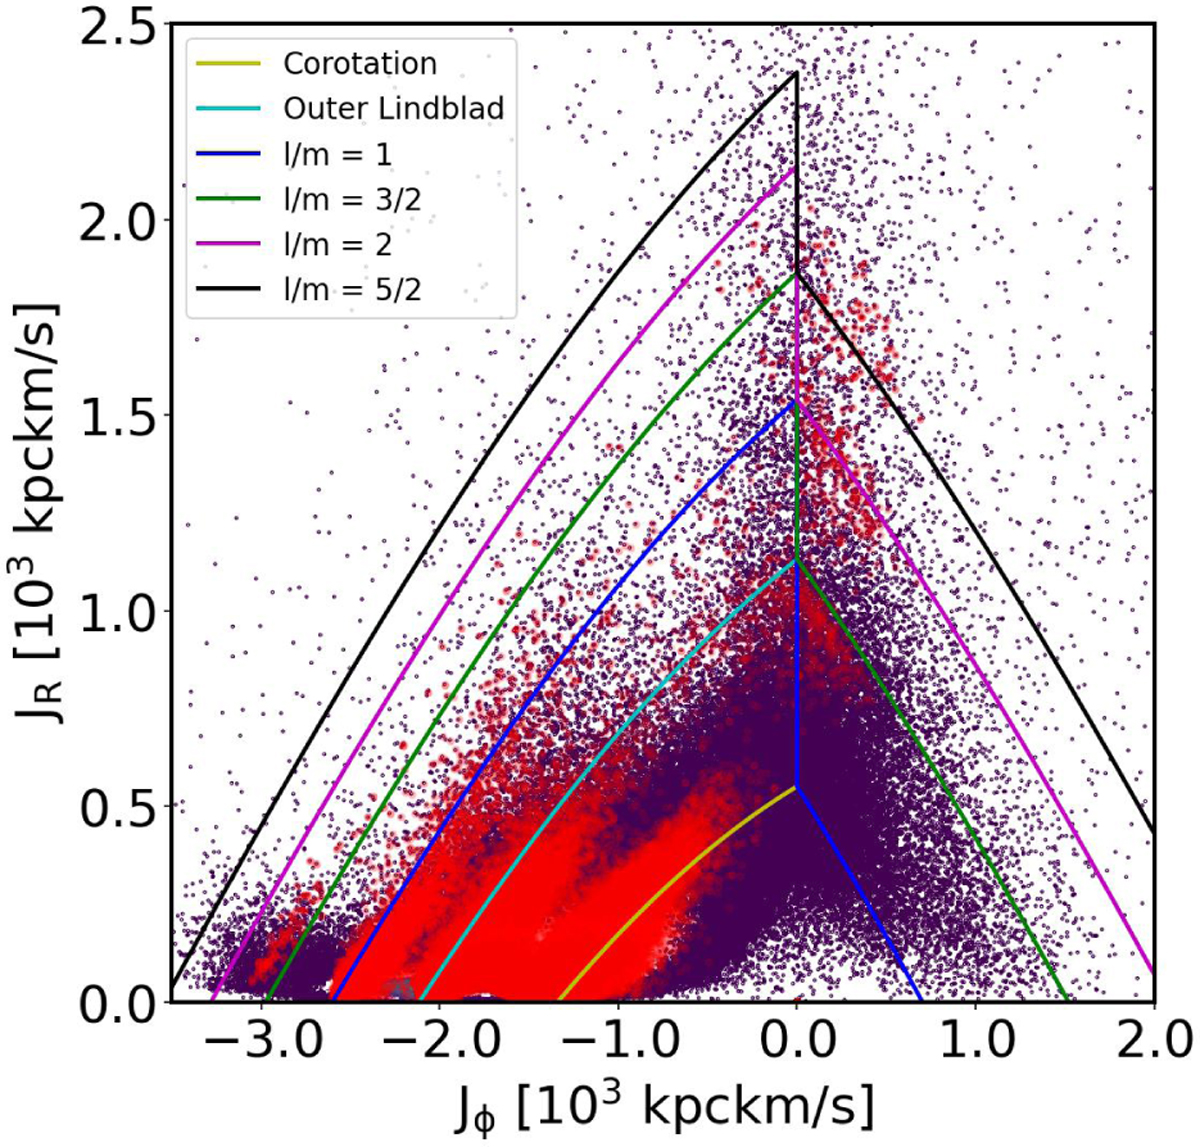
Density distribution consisting of the stars from our full sample in the Jϕ–JR plane, the red points are the stars on the overdensities in Figs. 1 and 4, and the coloured solid lines are the theoretical predictions for the loci of the different resonances at specific values of the l/m ratio (see the legend).
Current usage metrics show cumulative count of Article Views (full-text article views including HTML views, PDF and ePub downloads, according to the available data) and Abstracts Views on Vision4Press platform.
Data correspond to usage on the plateform after 2015. The current usage metrics is available 48-96 hours after online publication and is updated daily on week days.
Initial download of the metrics may take a while.