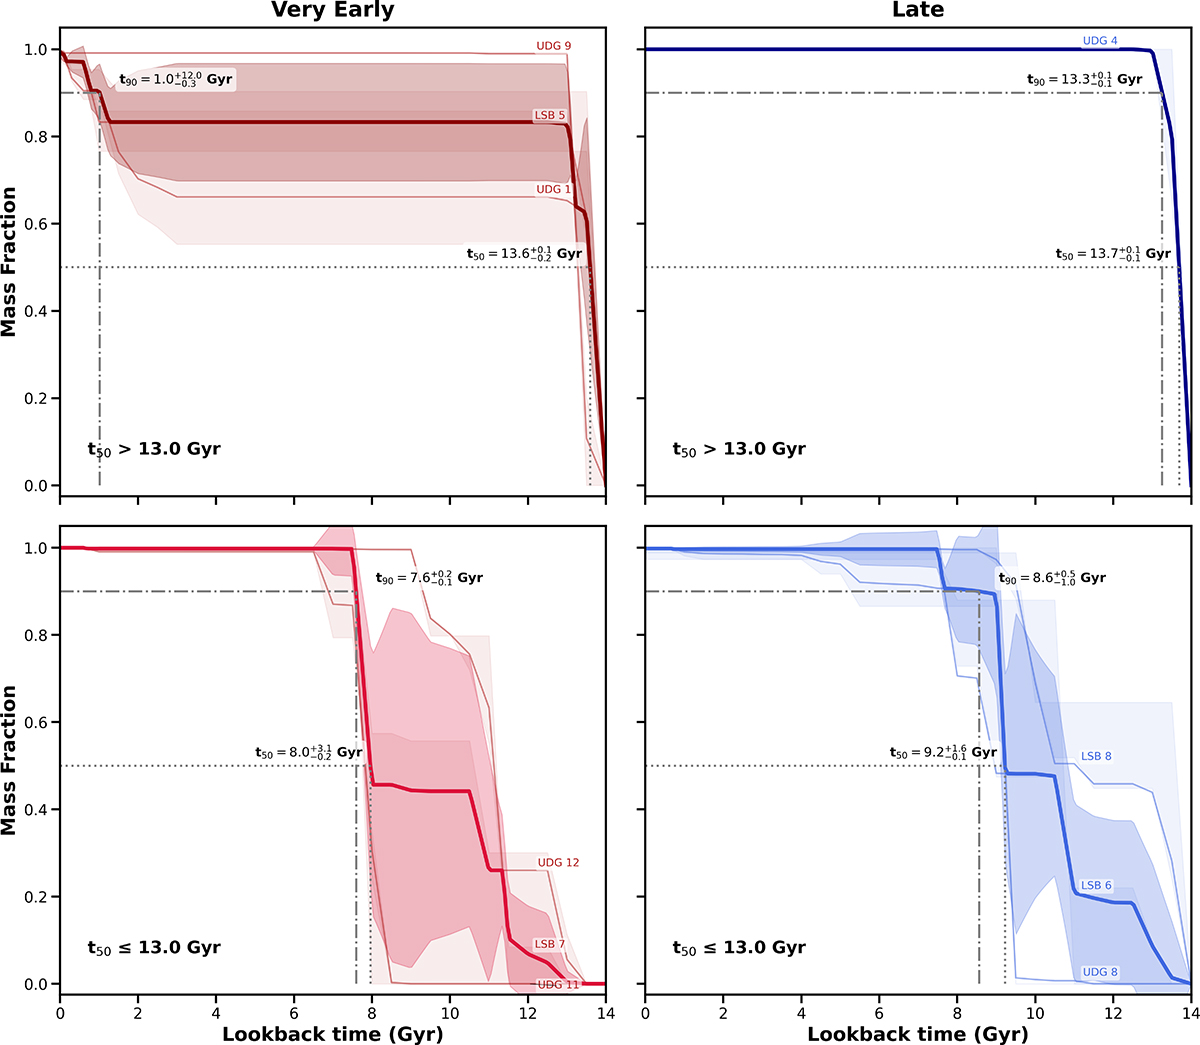
Fig. 3.
Download original image
SFHs of LEWIS galaxies: Very early quenching (t50 > 13 Gyr, upper panels) vs. normal to late quenching (t50 < 13 Gyr, lower panels). Lines are colour-coded as in Fig. 1, separating very early and late infallers. In each panel, the thin lines represent the individual SFHs of galaxies, whereas the thick solid line represents the median SFH. The grey lines represent the percentiles t50 and t90 of the mean SFHs.
Current usage metrics show cumulative count of Article Views (full-text article views including HTML views, PDF and ePub downloads, according to the available data) and Abstracts Views on Vision4Press platform.
Data correspond to usage on the plateform after 2015. The current usage metrics is available 48-96 hours after online publication and is updated daily on week days.
Initial download of the metrics may take a while.