| Issue |
A&A
Volume 707, March 2026
|
|
|---|---|---|
| Article Number | A88 | |
| Number of page(s) | 23 | |
| Section | Extragalactic astronomy | |
| DOI | https://doi.org/10.1051/0004-6361/202556736 | |
| Published online | 27 February 2026 | |
Looking into the faintEst WIth MUSE (LEWIS): Exploring the nature of ultra-diffuse galaxies in the Hydra-I cluster
V. Integrated stellar population properties
1
INAF – Astronomical Observatory of Capodimonte Salita Moiariello 16 I-80131 Naples, Italy
2
University of Naples “Federico II”, C.U. Monte Sant’Angelo Via Cinthia 80126 Naples, Italy
3
Instituto de Astrofísica de Canarias Calle Vía Láctea s/n 38200 La Laguna, Spain
4
Departamento de Astrofísica, Universidad de La Laguna E-38200 La Laguna Tenerife, Spain
5
Centre for Astrophysics & Supercomputing, Swinburne University of Technology Hawthorn VIC 3122, Australia
6
Sub-Dep. of Astrophysics, Dep. of Physics, University of Oxford, Denys Wilkinson Building Keble Road Oxford OX1 3RH, United Kingdom
7
Finnish Centre for Astronomy with ESO, (FINCA), University of Turku FI-20014 Turku, Finland
8
Tuorla Observatory, Department of Physics and Astronomy, University of Turku FI-20014 Turku, Finland
9
Turku Collegium for Science, Medicine and Technology (TCSMT), University of Turku FI-20014 Turku, Finland
10
INAF – Osservatorio Astronomico di Padova Vicolo dell’Osservatorio 5 I-35122 Padova, Italy
11
European Southern Observatory Karl–Schwarzschild-Strasse 2 85748 Garching bei München, Germany
12
INAF – Astronomical Observatory of Abruzzo Via Maggini 64100 Teramo, Italy
13
Dipartimento di Fisica e Astronomia “G. Galilei”, Università di Padova vicolo dell’Osservatorio 3 I-35122 Padova, Italy
14
Institute of Astronomy, University of Cambridge Madingley Road Cambridge CB3 0HA, UK
15
SRON Netherlands Institute for Space Research Landleven 12 9747 AD Groningen, The Netherlands
16
Kapteyn Astronomical Institute, University of Groningen Postbus 800 9700 AV Groningen, The Netherlands
17
European Southern Observatory Alonso de Cordova 3107 Vitacura Santiago, Chile
18
Gran Sasso Science Institute viale Francesco Crispi 7 I-67100 L’Aquila, Italy
★ Corresponding author: This email address is being protected from spambots. You need JavaScript enabled to view it.
Received:
4
August
2025
Accepted:
15
December
2025
Abstract
Context. This paper presents new results from the ESO Large Programme Looking into the faintEst WIth MUSE (LEWIS). The LEWIS sample consists of low-surface-brightness galaxies (LSBs) and ultra-diffuse galaxies (UDGs) located inside 0.4Rvir of the Hydra I cluster. Integral-field spectroscopy is acquired for 24 galaxies with the MUSE spectrograph mounted on the Very Large Telescope (VLT).
Aims. Our main objectives are to analyse possible correlations between the environment and the integrated stellar population properties of our targets, based on which we infer clues about their formation.
Methods. For each galaxy in the sample, we extracted the 1D stacked spectrum in an aperture of one effective radius Re and adopted previously published stellar kinematics to derive the age, metallicity, and [Mg/Fe] through a full spectral fitting technique.
Results. We find that the analysed LEWIS sample has a mean metallicity of ⟨[M/H]⟩= − 0.9 ± 0.2 dex and a mean age of 10 ± 2 Gyr, comparable to previous results of UDGs in other clusters. According to their position in the projected phase space, galaxies can be classified into two groups: very early infaller galaxies, which on average have slightly higher metallicities (⟨[M/H]⟩early = −0.8 ± 0.1 dex), and late infaller galaxies, with slightly lower values (⟨[M/H]⟩late = −1.0 ± 0.1 dex). According to their properties, late-infallers tend to be rotation-supported systems. Conversely, two types of galaxies are found in the early-infall region. Roughly half have metallicities consistent with the dwarf galaxy mass–metallicity relation. The other half show higher metallicities (with ⟨[M/H]⟩≥ − 1.0 dex) and are located outside the 1σ scatter of the mass-metallicity relation. The two subgroups of early-infallers also display different timescales for stellar mass assembly. Metal-rich galaxies reached 50% of their stellar mass in less than 1 Gyr and show a prolonged and almost constant star formation over more than 12 Gyr. The other galaxies exhibit a star formation history similar to that found for galaxies in the late-infall region. Both early and late infallers show solar-like α abundances.
Conclusions. From the analysis of stellar population properties presented in this work and of stellar kinematics previously obtained from LEWIS, we identified different classes of UDGs within the Hydra I cluster – as shown by metallicities, quenching timescales, and kinematics – which suggest different formation mechanisms. Almost all of the UDGs and LSBs in this cluster are consistent with the puffed-up dwarf formation scenario, having dwarf-like metallicities and being consistent with the mass-metallicity relation for dwarfs. In the innermost regions of the cluster, where more metal-rich UDGs are found, tidal effects or the environment might have influenced their formation and evolution.
Key words: galaxies: abundances / galaxies: clusters: general / galaxies: dwarf / galaxies: evolution / galaxies: formation
© The Authors 2026
 Open Access article, published by EDP Sciences, under the terms of the Creative Commons Attribution License (https://creativecommons.org/licenses/by/4.0), which permits unrestricted use, distribution, and reproduction in any medium, provided the original work is properly cited.
This article is published in open access under the Subscribe to Open model. This email address is being protected from spambots. You need JavaScript enabled to view it. to support open access publication.
1. Introduction
Ultra-diffuse galaxies (UDGs) are a distinct and intriguing class of low-surface-brightness (LSB) galaxies characterised by extremely low surface brightness (μ0, g > 24 mag arcsec−2), large effective radii (Re > 1.5 kpc), and low stellar masses (M ∼ 107 − 108.5 M⊙, see Van Nest et al. 2022, for a review on UDG definitions). Originally detected in the 1980s (e.g. Sandage & Binggeli 1984), these galaxies were rediscovered in large numbers in 2015 in the Coma cluster, thanks to advances in observational techniques and the development of instrumentation capable of probing LSB galaxies (van Dokkum et al. 2015; Koda et al. 2015). Since then, UDGs have been found in a wide range of environments, from galaxy clusters (e.g. Mihos 2015; Mancera Piña et al. 2018; Lim et al. 2020; La Marca et al. 2022) to groups (e.g. Trujillo et al. 2017; Forbes et al. 2019) and the field (e.g. Martínez-Delgado et al. 2016; Bellazzini et al. 2017).
Many observational studies have shown that UDGs span a wide range of properties in relation to their environment. For instance, UDGs in dense environments are found to be red, quenched, and spheroidal (Koda et al. 2015; van Dokkum et al. 2015, 2016; Ruiz-Lara et al. 2018; Lee et al. 2020). On the other hand, UDGs in less dense environments, such as in the field or group outskirts, are often bluer, irregular, and gas-rich (van der Burg et al. 2016; Leisman et al. 2017; Román & Trujillo 2017; Prole et al. 2019). Ultra-diffuse galaxies have even been identified at redshift z ∼ 0.3, providing evidence for their existence at earlier cosmic times (Janssens et al. 2017).
Theories regarding the formation of UDGs are diverse, with several mechanisms proposed to explain their distinct properties. A leading scenario is that UDGs are simply the extreme end of dwarf galaxy distribution, ‘puffed-up’ by either internal or external processes that produce large sizes and low surface brightness. Internal mechanisms include stellar feedback and/or high spins of the dark matter halo (Amorisco & Loeb 2016; Di Cintio et al. 2017; Rong et al. 2017; Tremmel et al. 2020). In contrast, models invoking external environmental effects suggest that tidal forces or ram-pressure stripping from a cluster environment could strip gas and quench star formation (SF), transforming a typical dwarf galaxy into a passive, LSB object (Yozin & Bekki 2015; Ogiya 2018; Bennet et al. 2018; Müller et al. 2019; Poggianti et al. 2019; Benavides et al. 2023).
Another suggested formation model comes from the ‘failed-galaxy’ hypothesis, where UDGs are remnants of early, dark matter-dominated systems that were quenched very early in cosmic history (van Dokkum et al. 2015; Peng & Lim 2016). These ‘failed’ galaxies are hypothesised to have been incapable of accreting sufficient gas or sustaining SF, leaving them with low stellar masses but residing in large, dark matter-dominated haloes. While this model has been difficult to reproduce in cosmological simulations, it could explain the massive dark matter haloes observed in some UDGs (Beasley & Trujillo 2016; Gannon et al. 2022; Forbes & Gannon 2024).
Simulations have advanced our understanding of UDGs. For instance, Sales et al. (2020) used the Illustris TNG100-1 simulation to study the formation of UDGs, distinguishing between two main populations: UDGs that are ‘born’ diffuse (B-UDGs) and UDGs that are transformed into diffuse galaxies through tidal stripping (T-UDGs). Born ultra-diffuse galaxies are typically field galaxies that retain their low surface brightness even after being accreted into clusters, while T-UDGs have experienced significant mass loss due to tidal interactions after entering the cluster environment. According to Sales et al. (2020), T-UDGs are older, more metal-rich, and have lower velocity dispersions than B-UDGs. The distinction between these two populations, supported by additional observational work (e.g. Gannon et al. 2020; Ferré-Mateu et al. 2018, 2023), offers a powerful framework for understanding the diverse properties of UDGs across different environments.
Large-scale photometric surveys such as the Systematically Measuring Ultra Diffuse Galaxies survey (SMUDGes, Zaritsky & Behroozi 2023) provide a broad overview of the UDG population but have limitations in directly comparing stellar populations – particularly in terms of mass and metallicity – due to inconsistencies in distance measurements and the lack of direct metallicity data. Recently, Buzzo et al. (2024b) has provided the most comprehensive analysis of UDG properties by systematically re-examining UDG samples from Buzzo et al. (2022) and Buzzo et al. (2024a) alongside a new nearly ultra-diffuse galaxy (NUDGes) sample, creating a large, unified dataset for statistical studies. The authors have identified two distinct sub-classes of UDGs: class A UDGs, which are less massive, elongated, and found in low-density environments, and class B UDGs, which are more massive, rounder, and located in denser environments. These results suggest that class A UDGs align with the puffed-up dwarf scenario, where internal processes such as stellar feedback and gas expulsion drive their expansion, whereas class B UDGs may be better explained by the failed galaxy formation scenario, possibly involving early quenching in dense environments.
Spectroscopic studies of UDGs have provided further constraints on the stellar population properties of UDGs. Those formed through internal feedback processes tend to have extended star formation histories (SFHs) and younger ages (∼6 − 9 Gyr), with metallicities comparable to those of classical dwarfs ([M/H] ∼ − 0.8 dex). In contrast, UDGs formed via the failed galaxy mechanism have older stellar populations (∼10 − 12 Gyr) and much lower metallicities ([M/H] ∼ − 1.5 dex; see e.g. Ferré-Mateu et al. 2018, 2023; Ruiz-Lara et al. 2018; Levitskiy et al. 2025). Studying the largest sample of UDGs with spectroscopic data until LEWIS and covering different environments and globular cluster (GC) richness, Ferré-Mateu et al. (2023) found that the local environment is relevant for the formation pathway of UDGs. In high-density environments, UDGs seem to have formed stars very early and have short quenching times (∼6 Gyr). Conversely, UDGs in low-density environments (such as groups and cluster outskirts) have younger ages and a prolonged SFH. These results are compatible with the inferred [α/Fe] ratios of UDGs, which are overall elevated but particularly so for those in high-density environments (≥0.3 dex).
In summary, having a large statistical spectroscopic sample is fundamental to studying not only the stellar population properties but also other structural properties, such as the amount of dark matter (DM), stellar kinematics, and stellar population properties of GC content. In this paper, we use spectroscopic data from LEWIS1. Looking into the faintEst WIth MUSE (PI: E. Iodice) is an ESO Large Programme approved in 2021, with 133.5 hours granted for the Multi Unit Spectroscopic Explorer on the VLT. LEWIS data have mapped, for the first time, a sample of 30 LSB galaxies in the Hydra-I cluster (Abell 1060, α (J2000) = 10h 36m 42.7100s, δ (J2000) = −27d 31m 42.900s). These galaxies represent the most extreme tail of the surface-brightness versus size distribution (Iodice et al. 2020; La Marca et al. 2022) mapped in Hydra-I from the VEGAS survey2. The majority (22) of LEWIS galaxies are classified as UDGs according to the van Dokkum et al. (2015) definition. The rest are extreme LSBs close to this definition but slightly brighter and/or smaller, akin to the NUDGEs (nearly-UDGs) definition from Forbes & Gannon (2024). Unlike most previous spectroscopic studies of UDGs, which compiled samples of galaxies from various environments, the LEWIS sample is homogeneous and allows for the study of a substantial number of galaxies within a single environment. This is crucial for understanding how the environment affects galaxies’ properties and for discriminating between different classes of UDGs.
The LEWIS project has been extensively presented in Iodice et al. (2023) (hereafter Paper I) together with the analysis of the location of LEWIS galaxies in the projected phase space (PPS) (Forbes et al. 2023). The LEWIS data allowed us to derive, for the first time, the integrated and spatially resolved stellar kinematics for a substantial sample of UDGs (Buttitta et al. 2025, hereafter Paper II). In LEWIS Paper III (Hartke et al. 2025), we constrained the formation history of the intriguing UDG32, finding that it formed from pre-processed material (see also Iodice et al. 2021), and in Paper IV (Mirabile et al. 2026), we constrain the characteristics of the GC populations of four UDGs.
In this paper, we focus on the integrated stellar population properties of galaxies in the LEWIS sample. The paper is organised as follows. In Section 2, we briefly present the LEWIS data. In Section 3, we describe the methodology adopted to derive the stellar population properties and SFHs. In Section 4, we present the properties of the LEWIS sample, while in Section 5, we discuss the plausible formation scenarios for the LEWIS UDGs. Finally, in Section 6, we report the conclusions and present future perspectives.
2. Data
Observations for the LEWIS survey were conducted using the MUSE integral-field spectrograph (Bacon et al. 2010) at the European Southern Observatory (ESO, Programme Id. 108.222P, PI: E. Iodice). MUSE was set to operate in Wide Field Mode without AO, offering a field of view (FOV) of 1′×1′ and a spatial resolution of 0.2 arcseconds per pixel. The Hydra I cluster is located at a distance of 51 ± 6 Mpc (Christlein & Zabludoff 2003), such that 1″ = 247.3 pc. The data cover a wavelength range of 4800–9300 Å with a spectral sampling of 1.25 Å/pixel and a mostly flat resolution profile (FWHM = 2.69 Å ; see Paper II for the details on the instrumental line-spread function).
The LEWIS sample presented in Paper I is composed of 30 galaxies: 22 are classified as UDGs, and eight are LSBs. From these 30 galaxies of the original sample, five were excluded because of the presence of Ferris-wheel-like patterns, i.e. the light diffraction of a bright star outside the FOV, or because the exposure was heavily contaminated by the presence of a bright, saturated star or a nearby galaxy. From the entire LEWIS sample of 30 galaxies, four UDGs had partial observations at the time this analysis was conducted. We therefore considered only the 26 remaining galaxies (see Table 2 from Paper II). Of these, UDG32 was further excluded because it was already the topic of a dedicated paper (Hartke et al. 2025). In Section 4, we further discuss the quality criteria we adopted to redefine the final sample for which accurate measures of stellar population properties were derived. The observations for LEWIS were completed in March 2025. The observations and data reduction of the final LEWIS sample are described in detail in Paper II.
3. Analysis
3.1. Age and metallicity
To obtain the mean stellar population properties of the LEWIS galaxies, we fitted the stacked spectrum extracted from an aperture of radius equal to an effective radius 1 Re with the package Penalized Pixel Fitting (ppxf, Cappellari 2017, 2023). The code uses single stellar population synthesis (SSP) models and allows masking of gas emission lines and low-S/N regions. Moreover, it allows multiplicative and/or additive polynomials to correct for the shape of the continuum.
As templates, we used the entire set of SSP models from sMILES (Knowles et al. 2023), with BaSTI isochrones, assuming a Kroupa initial mass function with a fixed slope of 1.3. The metallicities span from −1.79 to +0.26 dex, from 0.03 to 14 Gyr in age, and from −0.2 to +0.6 in [α/Fe]. The initial setup for the fitting is based on the main results from Paper II:
-
Wavelength range: We used the narrow region between 4800 Å–5400 Å. This is a relevant spectral range for stellar population studies, since it contains age- and metallicity-sensitive absorption lines, particularly for old stellar populations. This is also the spectral range where we have the best quality of the MUSE data.
-
Instrumental line-spread function (LSF): We adopted the LSF measured from Paper II. Given that our LSF is relatively flat, we fixed the template resolution at 2.69 Å for ease and speed of iterative computations.
-
Polynomial order: The literature frequently uses multiplicative and additive polynomials to account for spectral calibration issues and template mismatching (see e.g. Cappellari 2017). To avoid potential biases in computing the stellar population properties, we decided to use only multiplicative polynomials of order 6–10, using Paper II as a reference point.
The output of ppxf is a grid of weights assigned to each SSP model of the best-fit solution that allows obtaining mass or light-weighted age and metallicity of the observed galaxy’s spectrum. We ran a first fitting iteration at 4800 Å–5400 Å on the rest-frame spectra, masking consistently noisy regions and skyline residuals. From residuals of the first iteration, we set a masking threshold of 3σ that determines the number of pixels to be masked in a second iteration by using a simple sigma-clipping technique. To estimate the uncertainties in the stellar population properties, we followed an approach similar to that described in Paper II: we implemented a bootstrap-like procedure to generate several perturbations of the spectrum by adding Poissonian noise, which introduced a standard deviation in the S/N per pixel distribution of less than 3σ. Then we fitted the perturbed spectra by exploring a grid of randomly generated input parameters, emulating standard Monte Carlo approaches. We derived the mass-weighted metallicities and mean ages for the entire LEWIS stellar population sample, which are reported in Table 1.
Stellar populations properties of UDGs and LSBs in Hydra I.
3.2. Star formation histories
The analysis of the SFHs can reveal detailed evolutionary patterns of galaxies, offering a richer and more comprehensive understanding of their formation and evolution. Star formation quantities require a precise reconstruction of the SFH of the observed spectrum. From the output of ppxf it is possible to construct the SFH by collapsing the weights along the metallicity axis to generate a cumulative mass function that describes how the mass of a galaxy is built across cosmic time. Alternatively, one can construct the SFH by dividing the specific mass fraction generated by each SF episode by its associated time frame or age bin. We followed the first approach to construct cumulative mass fraction plots and derive age percentiles for the formed stellar mass.
From the recovered SFHs, we calculated two characteristic lookback times: when the galaxies formed 50% (t50) and 90% (t90) of their stellar mass, respectively. The value t90 is often used as a proxy for the quenching time, as the point at which the SF has effectively stopped (Ferré-Mateu et al. 2023). While most of our galaxies tend to present a single SF episode at early epochs, a few exceptions do show a shorter, minor recent starburst. For this reason, we also used t50 as a proxy for quenching throughout our study, as it tends to better represent the former, oldest star-formation episode shutdown. To quantify the evolutionary phase, we defined the duration of the formation phase, which measures the time elapsed between two stages of SF and allowed us to separate the evolution of the galaxy into two phases: the first phase Δt50 = tBB − t50 where we set tBB = 14 Gyr, and the second phase Δt90 = t50 − t90 (see Grèbol-Tomàs et al. 2023). In the first phase, we neglected the time that passed since the Big Bang and the onset of the first episode of SF in our galaxies, as adopted in Ferré-Mateu et al. (2023), because LEWIS galaxies tend to be old. Lower values of Δt mean a rapid SF, while higher values suggest that SF proceeds more slowly.
Given that different sets of weights can replicate the observed spectrum, these inherent degeneracies are commonly addressed through a regularisation technique, which selects the smoothest solution, suppressing solutions that exhibit abrupt variations in the age-metallicity plane (Cappellari 2017). While this introduces a potential bias, it typically generates a more realistic model. We tested the effects of regularisation and find no significant difference in the median recovered metallicity and age, similar to that reported previously in Ferré-Mateu et al. (2023). Thus, we decided to use the non-regularised solutions: we expected these to be comparable to literature SFHs of other UDGs, despite having a slightly ‘burstier’ shape. It is important to stress that this choice, combined with the low S/N of some sources, means that the recovered SFH for any individual galaxy can be sensitive to noise. Considering that these quantities can be affected by the regularisation, we focused exclusively on the median trends of SFH rather than considering individual SFHs to identify the broad differences in their evolutionary pathways.
From the mass-weighted metallicity weights, we derived the mass-to-light (M/L) ratio for each galaxy, using the corresponding transmission curves to compute photometric measurements for our spectra. Subsequently, we also obtained spectroscopic stellar masses (M*) by combining M/L ratios with the photometric r-band luminosity (Paper I). To construct a normalised SFH, we divided each collapsed mass weight by the age width of the corresponding grid template. Appendix B presents, for each galaxy, all the relevant stellar population information, including their ppxf fit, resulting age-metallicity weights, and their derived SFH.
3.3. Chemical abundances
The chemical abundance ratios provide another independent constraint on the SF timescale. For example, unlike the SFH lookback times, which reflect the totality of the mass assembly, the [α/Fe] ratio is a chemical clock for the phase and efficiency of the initial burst of SF. A high ratio is effectively the blueprint of a very short and intense timescale (< 1 Gyr), where enrichment from Type-II supernovae (producing heavy elements such as Mg) massively outpaces the slow enrichment from Type-Ia supernovae (Worthey et al. 1992).
To characterise abundances in our sample, we measured iron and magnesium indices, along with the Hβ0 as an age indicator. Due to our wavelength selection and median S/N, we decided to work exclusively with the [Mg/Fe] abundance as a [α/Fe] tracer, similarly to that performed in the literature. The line index measurement was performed with the latest version of pyphot3, and uncertainties were measured from perturbed spectra (injecting Poisson noise into the raw spectrum), also utilised for other error estimations. We adopted a combination of the following two methods:
-
We used the sMILES templates to construct model grids of Mg as a function of Fe (Fig. A.1). We used a regular, arithmetic average of Fe5015, Fe5270, and Fe5335, compared to the Mgb index, for different values of α-enhancement ([−0.2, +0.0, +0.2, +0.4, +0.6] dex), convolved to the spectral resolution of our data. In age and metallicity, we centred these grids at the ppxf-derived values. We interpolated according to the position of the data within the model grids.
-
Using the scaled-solar E-MILES models (Vazdekis et al. 2016), we constructed model grids of Hβ0 versus different metallicities, mainly Fe and Mg, to estimate the Mg and Fe enhancement on each galaxy from the proxy [Mg/Fe] = [ZMg/ZFe]=ZMg − ZFe (Vazdekis et al. 2015). However, due to the measured chemical composition of these galaxies, which makes many LEWIS measurements fall outside the range of the model grids (see Fig. A.2, upper panel) or in a very degenerate region, we replaced the Hβ0 indices by the proper light-weighted median age (Ferré-Mateu et al. 2014) from ppxf. This produces a more orthogonal model grid facilitating interpolation (see Fig. A.2, bottom panel).
The associated uncertainties for the derived [Mg/Fe] were obtained from Monte Carlo simulations of the different line indices involved. Overall, we find that the estimates from both methods are consistent; hence, we used the average of both for the final [Mg/Fe] value. The only exceptions are UDG 1 and LSB 5, for which the second method did not provide reliable results, and thus we limit them to the results of method 1.
We estimated the [α/Fe] abundance using the formula below. We assumed that the sMILES models (with BaSTI isochrones) behave similarly to the regular Base E-MILES models on which this formula is based (Vazdekis et al. 2015):
![Mathematical equation: $$ \begin{aligned}{[\alpha /\mathrm{Fe}]} = 0.02+0.56\times [Z_{\rm Mg}/Z_{\rm Fe}], \end{aligned} $$](/articles/aa/full_html/2026/03/aa56736-25/aa56736-25-eq1.gif) (1)
(1)
4. Results: Stellar populations properties of LEWIS galaxies
In Table 1, we report all the quantities derived from the analysis of stellar population properties for those galaxies which have constrained kinematics (see Table 2 from Buttitta et al. 2025, for details). They are the ages, metallicities [M/H], stellar masses M*, chemical abundances [Mg/Fe], and characteristic lookback times (t50 and t90). In addition, we report the classification in the PPS diagram as presented in Paper II.
The accuracy of the results strongly depends on the quality of the spectra and the reliability of stellar kinematics parameters. In particular, the effective velocity dispersion σeff could be sensibly overestimated in poor-quality spectra and thus cannot be used in the extraction of stellar population properties (see Paper II for details). The final LEWIS sample presented in Paper II is composed of 25 objects (19 UDGs and 6 LSBs), but stellar kinematics were accurately derived for only a sub-sample. In this work, we used the same classification presented in Paper II to identify galaxies with precise measurements of stellar kinematics parameters, with reliable stellar population properties. The ‘C’ (constrained fit) galaxies have high-quality spectra and reliable estimates of stellar kinematics; the ‘I’ (intermediate fit) objects might have biased stellar kinematics parameters due to the presence in their spectra of sky line residuals close to absorption features; and ‘U’ (unconstrained fit) galaxies have low quality spectra and thus the spectral fitting is unreliable.
In this work, we present accurate measurements for only constrained cases (ten galaxies), six of which are classified as UDGs and the remaining four are LSB galaxies. The main conclusions presented in this work are based only on this sample, whereas results of the stellar population analysis of the intermediate cases (UDG3, UDG7, UDG10, LSB1, and LSB4) are discussed in Appendix C.
4.1. Age, metallicities, and chemical abundance
Figure 1 (left panel) shows the mean mass-weighted ages as a function of metallicity [M/H] for the LEWIS sample and literature data on cluster UDGs from Ferré-Mateu et al. (2023). For LEWIS, we find a mean metallicity ⟨[M/H]⟩= − 0.9 ± 0.2 dex and an average age of ⟨Age⟩ = 10 ± 2 Gyr, consistent with these literature studies (⟨Age⟩ = 8.9 ± 2.7 Gyr and ⟨[M/H]⟩= − 1.0 ± 0.4 dex). We find that the derived ages of LEWIS UDGs are also consistent with the ages of MATLAS classical dwarfs analysed in Heesters et al. (2023) (Age ∼ 6 − 14 Gyr), although the latter are on average more metal-poor overall ([M/H] = − 1.9 to −1.3 dex), coming from low-to-moderate density environments. The dwarf galaxy sample of the SAMI-Fornax survey (Romero-Gómez et al. 2023) instead shows slightly younger (⟨Age⟩∼8 Gyr) and more metal-rich ([M/H] = − 0.4 dex) values, but a direct comparison is hard to establish since they only report luminosity-weighted quantities.
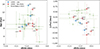 |
Fig. 1. Stellar population properties of LEWIS galaxies. Left panel: Mean mass-weighted ages as a function of metallicities [M/H] for the LEWIS sample (coloured data points) and the literature UDGs (green circles, from Ferré-Mateu et al. 2023). The red and blue circles represent galaxies classified as very early and late infallers, respectively. Right panel: Chemical abundance [α/Fe] as a function of metallicities [M/H]. Data points are colour-coded as in the left panel. |
In Fig. 1, we marked with different colours the LEWIS galaxies belonging to the two regions of the PPS, i.e. very early and late infallers (see also column 2 in Table 1). To remind the reader, very early infallers are those galaxies that entered the cluster at least ∼7 Gyr ago and are thus virialised with the cluster. By contrast, late infaller galaxies are in the process of approaching the cluster for the first time or have already passed the first pericentre (Fig. 4, see also Rhee et al. 2017; Forbes et al. 2023). This infall diagnostic diagram allows us to highlight possible dependencies between structural properties of the galaxies and the cluster. We notice that overall early infall galaxies appear to have somewhat higher metallicities compared to late infall ones.
Figure 1 (right panel) shows the chemical abundance [α/Fe] as a function of the metallicity [M/H] for the LEWIS sample and literature data of cluster UDGs from Ferré-Mateu et al. (2023). We computed the [α/Fe] using Eq. (1) to directly compare our findings with UDGs in the literature. Overall, LEWIS galaxies show values similar to the UDGs in literature from Ferré-Mateu et al. (2023), ranging from sub-solar ([α/Fe] ∼ −0.5 dex) to super-solar ([α/Fe] ∼ +0.5 dex) abundances. Except for UDG1, we note that all the sub-solar objects are LSBs, whereas other sources display an enhancement consistent with regular dwarfs or slightly above, as observed in the literature data for UDGs.
4.2. The mass-metallicity relation
Figure 2 shows the mass-metallicity relation for all the LEWIS galaxies analysed in this work, compared with other studies in the literature that analysed samples of UDGs and dwarf galaxies in different environments. Considering the uncertainties, seven out of ten galaxies analysed in this work have metallicity consistent with the relation found for the dwarf galaxies (Kirby et al. 2013) and with most of the UDGs studied by Buzzo et al. (2024a) and Ferré-Mateu et al. (2023). The remaining three galaxies (UDG1, UDG9 and LSB5) have higher metallicities than dwarf galaxies with similar stellar mass and are located outside the 1σ confidence region of the Kirby et al. (2013) mass-metallicity relation for dwarfs. Values are consistent with the observed scatter for the UDGs in the literature.
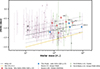 |
Fig. 2. Mass-metallicity relation. LEWIS data points are colour-coded as in Fig. 1, while other coloured data points correspond to literature samples: UDGs in clusters (light green circles) and in low-density environments (dark green diamonds) from Ferré-Mateu et al. (2023), UDGs in low-density environments (violet circles) from Buzzo et al. (2024a), and UDGs and nearly UDGs in high-density environments (violet diamonds) from Buzzo et al. (2024b). The solid black line represents the mass-metallicity relation found for dwarf galaxies, assuming a constant α-enhancement (Kirby et al. 2013), and the dashed grey lines represent the 1σ and 2σ confidence regions of the relation. The yellow line represents the evolving mass-metallicity relationship at redshift z ∼ 2.2 from Ma et al. (2016). |
Different from the UDGs samples by Buzzo et al. (2024a) and Ferré-Mateu et al. (2023), at stellar masses higher than 108 M⊙, we do not find LEWIS galaxies with metallicities lower than those expected for dwarf galaxies of comparable stellar masses, i.e. [M/H] ≲ −1.5 dex. This result can have implications for the formation channels for UDGs and will be discussed in Sect. 5.
Finally, according to the PPS, we notice that late-infallers overall have metallicities consistent with the Kirby et al. (2013) relation for dwarfs. Early-infallers, however, are either consistent or present higher values.
4.3. Star formation histories and quenching times
Figure 3 shows the SFHs of LEWIS galaxies, separated by their PPS positioning and quenching times as traced by Δt50. For the late infaller group (right panels), we find a median lookback time of  Gyr and
  Gyr. The above estimates exclude UDG4, which shows a different SFH (see top-right panel of Fig. 3). This object quenched earlier (
 Gyr) and very fast (Δt90 = ∼0.7 Gyr).
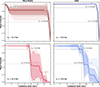 |
Fig. 3. SFHs of LEWIS galaxies: Very early quenching (t50 > 13 Gyr, upper panels) vs. normal to late quenching (t50 < 13 Gyr, lower panels). Lines are colour-coded as in Fig. 1, separating very early and late infallers. In each panel, the thin lines represent the individual SFHs of galaxies, whereas the thick solid line represents the median SFH. The grey lines represent the percentiles t50 and t90 of the mean SFHs. |
We find that the very early infall region of the PPS shows a wide range in both metallicity and quenching times. We find that sources with fast and early quenching (UDG1, UDG9, LSB5; upper left panel in Fig. 3) correspond to the three most metal rich sources in the mass-metallicity relation, as they appear at > 1σ of the Kirby et al. (2013) line for dwarf galaxies. The three other galaxies (UDG11, UDG12 and LSB8; lower left panel in Fig. 3) seem to be consistent with the standard relationship instead.
The metal-rich galaxies present a SF peak at an early epoch  Gyr, with a subsequent slow and constant mass assembly phase (see Fig. 3, upper left panel), with similar t90 ∼ 1 Gyr. This behaviour is atypical in galaxies located in the innermost regions of the cluster. Two of these galaxies (UDG1 and LSB5) also have low values of chemical abundance ([Mg/Fe] ∼ − 1 dex). These findings suggest that these galaxies might be interlopers in the PPS or have suffered inefficient environmental quenching. The remaining three galaxies in the early-infall region (UDG11, UDG12, and LSB8) show a smooth trend of the SFH (see Fig. 3, lower left panel), where
  Gyr and
  Gyr. It is worth noting that the SFH for these three objects in the early infall region of the cluster is quite similar to that observed for the late infallers. In particular, both groups build up their mass at a similar speed during the first phase of their mass assembly, as their t50 estimates are consistent within uncertainties, and also, during the second phase of their formation history, driven by Δt90, which are also comparable (Δt90, early ∼ 4 Gyr and Δt90, late ∼ 3 Gyr).
4.4. Trends within the cluster environment
In Fig. 4 we present PPS infall diagrams colour-coded with properties derived from stellar population analysis of this work and stellar kinematics from Paper II. In the top panels of Fig. 4, we show the LEWIS galaxies colour-coded according to stellar mass M* (top left) and metallicity [M/H] (top right) derived from stellar populations analysis. We do not see any clear trend between M* and the galaxy location within the cluster, but we find a mild distinction in metallicity between the two groups. Except for UDG11, the majority of very early infallers show higher values of metallicities with respect to late infall galaxies. We compute the mean metallicities values in the two groups, and we find ⟨[M/H]⟩early = −0.8 ± 0.1 dex for very early infallers, and ⟨[M/H]⟩late = −1.0 ± 0.1 dex for late infallers.
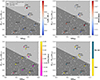 |
Fig. 4. Global properties of LEWIS galaxies as a function of the cluster environment. The PPS diagram shows the relative velocity versus the projected radius for the LEWIS sample (coloured points), and galaxies from Christlein & Zabludoff (2003) catalogue (white circles). LEWIS galaxies are colour-coded according to the stellar mass (top-left panel), metallicity (top-right panel), chemical abundance (lower-left panel), and presence of rotation (lower-right panel). The shaded grey regions indicate different infall stages (Rhee et al. 2017; Forbes et al. 2023): early infall (dark grey) and late infall (light grey). |
In the bottom panels of Fig. 4, we show the LEWIS galaxies colour-coded according to the α abundance (bottom left) and the presence of stellar rotation (bottom right). As already pointed out in Section 4.1, galaxies span a wide range of [α/Fe] values, and we do not see a clear trend with the environment. Both early and late infallers show solar-like α abundances. In terms of stellar rotation, except for UDG4, galaxies in the late infall region have hints of stellar rotation, whereas in early infall regions, we find both galaxies with or without stellar rotation.
4.5. Correlation with stellar kinematic properties
From the stellar kinematic study of LEWIS galaxies (Paper II), we find two different kinematical classes of UDG and LSB galaxies in the Hydra I cluster. Almost half of the galaxies in the sample show significant stellar rotation. The remaining half of the galaxies do not show signs of rotation. According to the PPS and considering that the present sample consists of only ten objects in total, we cannot draw a firm conclusion on a possible trend of the two kinematic classes with the cluster environment. We note that the early infall region of the cluster, where most of the metal-richer objects are found, is populated by a mix of rotation-supported and pressure-supported galaxies as well (Fig. 4, bottom-right). Three out of the four galaxies located in the late infall region are rotation-supported.
Figure 5 shows the stellar velocity dispersion values extracted from the stacked spectrum in an aperture equal to 1Re (σe, see Paper II) as a function of their chemical abundance [α/Fe]. On average, LEWIS galaxies cover the same region populated by other UDGs from the literature, expanding the range of measured [α/Fe] from sub-solar to slightly super-solar regime. Even considering the large scatter, values for the LEWIS sample are consistent with the observed values for dwarf galaxies (Romero-Gómez et al. 2023), whose trend is marked in the figure with the shaded and dashed blue region.
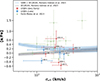 |
Fig. 5. Velocity dispersion measurements as a function of alpha abundances. LEWIS galaxies are colour-coded as in Fig. 1. Green triangles are UDGs analysed by Ferré-Mateu et al. (2023). Values of σeff for LEWIS are from Paper II. The dashed black line and the corresponding shaded region represent the average trend of massive early-type galaxies from ATLAS3D survey (Cappellari et al. 2011). The light blue line and the corresponding shaded region represent the average trend ATLAS3D survey together with the sample of dwarf galaxies in the Fornax cluster from the SAMI survey (Romero-Gómez et al. 2023). |
In Fig. 6, we show the SFHs of LEWIS galaxies for the two kinematic types. We find that galaxies without signs of rotation present an initial fast SF phase, forming 90% of their stellar masses in Δt90 ∼ 1 Gyr. In contrast, galaxies that rotate show more time-extended SF, forming half of their stellar masses in Δt50 ∼ 3 Gyr. Some individual cases have exceptional behaviour. Among the rotation-supported galaxies, UDG1 has a unique SFH, which is particularly prolonged. Interestingly, the two pressure-supported galaxies, UDG9 and LSB5, are the outliers in the mass-metallicity relation, having higher metallicities than all the other galaxies of the sample. UDG4 is the only object with a different SFH in the late infall region.
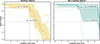 |
Fig. 6. SFHs of LEWIS galaxies and stellar kinematics properties. Galaxies are separated according to the kinematic type as described in Paper II: Presence of rotation (left panel) vs. non-rotating objects (right panel). Thick solid lines correspond to the average SFH for each panel, and shaded lines correspond to the standard deviation of the distribution. Similarly to Fig. 3, the grey lines correspond to t50 and t90, respectively. |
5. Discussion: The formation history of UDGs in the Hydra I cluster
The main goal of this section is to investigate the history of UDG formation in the Hydra I cluster by comparing the observed properties of this class of galaxies, derived from the LEWIS project, with predictions from simulations on UDG formation. To this aim, we briefly summarise the main structural properties of the galaxies in the LEWIS sample.
By combining the stellar population properties (this work) with the stellar kinematics (Paper II), we find that the overall structure of UDGs and LSB galaxies in Hydra I is a function of the environment where they reside. In particular, according to the PPS (see Fig. 4), we find that:
-
Very early infallers (N = 6) comprise at least two different types of galaxies. We found a group of galaxies with metallicities consistent within error bars with the mass-metallicity relation (UDG11, UDG12, LSB7). Another group of galaxies, instead, has higher metallicity (UDG1, UDG9, LSB5) and is located outside the 1σ confidence region of the mass-metallicity relation. The two groups show different trends of SFH. Metal-rich galaxies show a fast mass assembly phase at an early epoch, with t50 ∼ 13.6 Gyr, and minor SF afterwards. In both groups, galaxies are either pressure-supported systems (UDG9, UDG11, and LSB5) or show hints of rotation (UDG1, UDG12, and LSB7).
-
Late infallers (N = 4) generally present more homogeneous properties in terms of metallicity, since they seem to follow the standard mass-metallicity relationship from classical dwarfs. Among them, only UDG4 has super-solar α-abundance and does not have hints of rotation. Almost all the other late infallers have solar-like [α/Fe] and are rotation-supported systems.
-
Except for metal-rich galaxies, both early and late infallers are consistent with the mass-metallicity relation and show a similar SFH (see Fig. 3). They build up their mass at a similar speed during the entire mass assembly period, where t90 ∼ 8 Gyr for the very early infallers and t90 ∼ 9 Gyr for the late infallers.
A summary of the properties of the UDGs/LSB populations found in Hydra I, described above, is reported in Table 2.
Stellar populations properties of early and late UDG populations in Hydra I.
5.1. How do the structural properties of the LEWIS galaxies compare with dwarfs?
Since UDGs and LSB galaxies represent the faint end of the luminosity function of dwarf galaxies, we examined how the observed properties of the two classes of objects compare. This analysis has fundamental implications on the possible formation channels for UDGs in the Hydra I cluster.
Firstly, according to La Marca et al. (2022), colours and structural parameters of the light distribution of all UDGs and LSB galaxies are similar to those of the parent dwarf galaxy population. With the LEWIS data, we can compare the stellar kinematics and populations with same quantities derived for dwarf galaxies in other clusters of galaxies4.
According to the standard picture of dwarf galaxy evolution (Mistani et al. 2015), very early infallers are expected to have an increased α-abundance pattern, low metallicity, old ages, and a large amount of GCs (Forbes et al. 2023). In previous literature, UDG and LSB metallicities have been shown to have only a weak correlation with clustercentric distance (e.g. Romero-Gómez et al. 2023; Ferré-Mateu et al. 2018), yet low number statistics and the very limited number of studied environments (mostly Coma, Virgo and Perseus, see Ferré-Mateu et al. 2023; Gannon et al. 2024 and references therein) have hindered strong conclusions.
Overall, in the Hydra I cluster, we observe that late infallers exhibit properties similar to those of regular dwarfs. Conversely, very early infallers display a larger scatter in all properties (metallicity, α-enrichment, and stellar kinematics), indicating that they likely contain galaxies that have undergone at least two distinct evolutionary paths. In particular, based on the SFH shape, or more specifically, the [α/Fe] ratio, two major populations are found.
A sub-population of the LEWIS sample resembles the properties of regular dwarfs (LSB5, LSB6, LSB7, LSB8, UDG1, UDG8) with their low-to-‘near-solar’ [α/Fe] ratios and extended SFHs. These could include the LSB tail of either high-metallicity dwarf spheroidals (UDG1, LSB6, LSB7, LSB8, possibly slightly enriched by their medium yet supported by their rotation) or SF-inefficient dwarf ellipticals (LSB5). These are consistent with the mass-metallicity relationship for dwarfs, perhaps slightly enriched by the Hydra-I environment. According to the findings of Paper II, most of these galaxies, regardless of their strict UDG/LSB classification, appear to be DM-rich and exhibit rotation. In particular, as shown in Fig. 5 of Paper II, the projected specific angular momentum (λR) found for these objects is comparable with typical values derived for dwarf galaxies of similar stellar masses. The rest of the LEWIS sample is consistent with the recent UDG literature, showing solar-like or super-solar [α/Fe] patterns and fast mass assembly.
5.2. Comparing the observed properties with predictions from simulations
The LEWIS sample consists of galaxies located within 0.4Rvir of Hydra I, meaning we are mapping a high-density environment. Therefore, we focus solely on comparison with theoretical predictions of UDGs in clusters.
Using the Illustris-TNG simulations, Sales et al. (2020) and Benavides et al. (2023) provided detailed properties on both stellar kinematics and stellar populations in cluster UDGs, under the assumption that all their UDGs are dispersion-supported systems. In this scenario, the T-UDGs, i.e. galaxies transformed into UDGs through tidal stripping, are predicted to have higher metallicity and lower velocity dispersion than dwarf galaxies of comparable stellar mass and the B-UDGs, which are field galaxies born as UDGs that later join the cluster. Since almost half of the UDGs in the Hydra I cluster are rotation-supported, a direct comparison with predictions from Sales et al. (2020) can be performed only for the dispersion-supported galaxies, considering those targets having a constrained fit for the stellar kinematics (see Sect. 2 and Paper II). These are UDG4, UDG9, UDG11, and LSB5 (see Table 1). Examining the mass-metallicity relation in Fig. 2, UDG9 and LSB5 are outliers, exhibiting higher metallicity than those for dwarf galaxies of similar stellar masses. None of these two galaxies shows a velocity dispersion σe lower than the typical values for dwarf galaxies, as predicted by the Faber-Jackson relation (see Fig. 4 in Paper II). However, given the large scatter of the simulated UDGs in this relation, the tidal-stripping origin for these galaxies cannot be excluded. Both LSB5 and UDG9 are located in the early-infall region of the PPS, where tidal interactions between galaxies are clearly detected (Spavone et al. 2024), and where T-UDGs are expected to be found.
UDG4 and UDG11 have σeff and metallicities consistent with the expected Faber-Jackson and mass-metallicity relations. Combining velocity dispersion measurements with metallicity estimates, these LEWIS galaxies might resemble the B-UDGs in the framework proposed by Sales et al. (2020). However, the number density of B-UDGs in these simulations is predicted to be higher in the cluster outskirts, with a half-number radius of about 0.5 of the virial radius. Since the LEWIS sample covers ∼0.4 Rvir of the Hydra I cluster, not many B-UDGs should be expected in our sample.
UDG1, instead, has hints of stellar rotation and thus cannot be directly compared with Sales et al. (2020) prediction. This galaxy is a peculiar case. It is located in the very early infall region of the PPS, but differently from almost all other UDGs and LSBs in this region, it has a slow and constant mass assembly phase with a second, more recent starburst at ∼2 Gyr. This is hard to be reconciled with a standard tidal origin or a failed formation channel.
Results from UDGs in the TNG50 simulations provide constraints on metallicity (Benavides et al. 2023, 2024), which can be compared with estimates derived in this work. Authors argued that these UDGs, embedded in a dwarf-like DM halo, might originate from a dwarf progenitor whose stellar content is puffed up due to a high-spin DM halo. Simulated quenched UDGs are on average metal-poor, ranging from [Fe/H] ∼ −1.3 [dex] at M* ∼ 107.5 M⊙ and [Fe/H] ∼ −0.9 [dex] at M* ∼ 109 M⊙, and are consistent with the MZR relation for dwarf galaxies (Kirby et al. 2013), even considering the large scatter of values.
The metallicity of the LEWIS galaxies spans a range −1.3 ≤ ⟨[M/H]⟩≤ − 0.5 dex, with stellar masses M* ≤ 109 M⊙ (see Fig. 2). Taking into account the error estimates, almost all LEWIS galaxies, except the three objects with the highest metallicities, show comparable values to those predicted by the simulations cited above. Therefore, considering the small scatter around the mass-metallicity relation, and the similarities in other structural properties (integrated colours, light distribution, SFH, α-enhancement, stellar kinematics), all of them might reconcile with a puffed-up origin.
In the mass-metallicity relation, none of the galaxies in the LEWIS sample shows metallicity lower than ∼ − 1.5 dex (see Fig. 1). As suggested by Buzzo et al. (2024a) and Ferré-Mateu et al. (2023), very low metallicities, consistent with the evolving mass-metallicity relationship at redshift z ∼ 2.2, are expected for the UDGs formed as the ‘failed-galaxy’ scenario (see Fig. 2). However, we cannot rule out their presence at the outskirts of the cluster, beyond the area covered by LEWIS.
6. Summary and conclusive remarks
In this paper, we presented the stellar population properties for a homogeneous sample of UDG and LSB galaxies in the Hydra I cluster of galaxies observed with the MUSE integral-field spectrograph at ESO-VLT, as part of the LEWIS large programme (Iodice et al. 2023). We derived the age, metallicity, and α-abundances for ten galaxies in the LEWIS sample (see Table 1). Overall, we find that these galaxies exhibit ages and metallicities consistent with typical values for dwarf galaxies of comparable stellar mass, including literature estimates for UDGs. The stellar population properties derived in this work, together with the stellar kinematics presented in Paper II, are analysed as a function of the cluster environment using the PPS.
In the late-infall region of the PPS, we identified a single population of galaxies with the lowest metallicities, nearly all of which are rotation-supported systems. In contrast, the early-infall region contains two types of galaxies: roughly half have metallicities consistent with the dwarf galaxy mass–metallicity relation, while the other half show higher metallicities (with ⟨[M/H]⟩≥ − 1.0 dex), lying outside the 1σ confidence region of that relation. Both sub-samples include rotation- and pressure-supported systems. Galaxies in this region of the cluster also display different timescales for stellar mass assembly. Metal-rich galaxies reached 50% of their stellar mass in less than 1 Gyr before a shutdown in SF. UDG1 (and possibly LSB5) do show a second, localised peak at intermediate ages (1–2 Gyr). All other galaxies exhibit a SFH similar to that found for galaxies in the late-infall region.
By comparing the observed properties for LEWIS galaxies with possible formation channels, we suggested that most of the UDGs and LSBs inside the 0.4Rvir of the Hydra I cluster are likely puffed-up dwarfs. We propose that the high-metallicity systems have undergone significant stellar evolution driven by tidal processes, likely through interactions with nearby bright and massive galaxies (see Spavone et al. 2024, and references therein). This interpretation is supported by their location in the cluster core and northern group, where deep imaging has revealed clear signatures of ongoing gravitational interactions, such as tidal tails and disrupted dwarf galaxies. Finally, we do not find any galaxies consistent with the ‘failed-galaxy’ scenario, primarily due to the absence of very low-metallicity systems in our sample. However, we cannot rule out the existence of such systems in the cluster outskirts, beyond the area covered by LEWIS.
In this work, we attempted for the first time to correlate the spatial information from stellar kinematics (from Paper II) with age, metallicity, and SFH. We expect to place even tighter constraints on the formation histories of UDGs in Hydra I by combining the structural properties derived so far (from stellar populations and stellar kinematics) with the GC content (Mirabile et al. 2026).
Acknowledgments
We wish to thank the anonymous Referee whose comments helped us to improve the clarity of the manuscript. Based on observations collected at the European Southern Observatory under ESO programmes 108.222P.001, 108.222P.002, 108.222P.003. The authors wish to thank the Instituto de Astrofísica de Canarias for their hospitality and mentorship during January to April. Additionally, we are grateful to Jonah Gannon, Maria Luisa Buzzo, Thomas Puzia, and Alexandre Vazdekis for their helpful discussions and valuable suggestions. E.I. acknowledges support by the INAF GO funding grant 2022-2023. EI, EMC and MP acknowledge the support by the Italian Ministry for Education University and Research (MIUR) grant PRIN 2022 2022383WFT “SUNRISE”, CUP C53D23000850006. EMC acknowledges the support from MIUR grant PRIN 2017 20173ML3WW-001 and Padua University grants DOR 2021-2023. GD acknowledges support by UKRI-STFC grants: ST/T003081/1 and ST/X001857/1. A.F.M. has received support from RYC2021-031099-I and PID2021-123313NA-I00 of MICIN/AEI/10.13039/501100011033/FEDER,UE, NextGenerationEU/PRT DF thanks the ARC for support via DP220101863 and DP200102574. J.F-B acknowledges support from the PID2022-140869NB-I00 grant from the Spanish Ministry of Science and Innovation. J.H. and E.I. acknowledge the financial support from the Visitor and Mobility program of the Finnish Centre for Astronomy with ESO (FINCA). This work is based on the funding from the INAF through the GO large grant in 2022, to support the LEWIS data reduction and analysis (PI E. Iodice). The authors thank Gannon et al. (2024) for the compilation of their catalogue of UDG spectroscopic properties. The catalogue includes data from: McConnachie (2012), van Dokkum et al. (2015), Beasley & Trujillo (2016), Martin et al. (2016), Yagi et al. (2016), Martínez-Delgado et al. (2016), van Dokkum et al. (2016, 2017), Karachentsev et al. (2017), van Dokkum et al. (2018), Toloba et al. (2018), Gu et al. (2018), Lim et al. (2018), Ruiz-Lara et al. (2018), Alabi et al. (2018), Ferré-Mateu et al. (2018), Forbes et al. (2018), Martin et al. (2019), Chilingarian et al. (2019), Fensch et al. (2019), Danieli et al. (2019), van Dokkum et al. (2019), Torrealba et al. (2019), Iodice et al. (2020), Collins et al. (2020), Müller et al. (2020), Gannon et al. (2020), Lim et al. (2020), Müller et al. (2021), Forbes et al. (2021), Shen et al. (2021), Ji et al. (2021), Huang & Koposov (2021), Gannon et al. (2021, 2022), Mihos et al. (2022), Danieli et al. (2022), Villaume et al. (2022), Webb et al. (2022), Saifollahi et al. (2022), Janssens et al. (2022), Gannon et al. (2023), Ferré-Mateu et al. (2023), Toloba et al. (2023), Shen et al. (2023). The authors acknowledge the use of the following Python scripts: ASTROPY (Astropy Collaboration 2013, 2018), MATPLOTLIB (Hunter 2007), MPDAF (Bacon et al. 2016; Piqueras et al. 2017), NUMPY (van der Walt et al. 2011), PHOTUTILS (Bradley et al. 2023), SCIPY (Virtanen et al. 2020), and ZAP (Soto et al. 2016).
References
- Alabi, A., Ferré-Mateu, A., Romanowsky, A. J., et al. 2018, MNRAS, 479, 3308 [Google Scholar]
- Amorisco, N. C., & Loeb, A. 2016, MNRAS, 459, L51 [NASA ADS] [CrossRef] [Google Scholar]
- Astropy Collaboration (Robitaille, T. P., et al.) 2013, A&A, 558, A33 [NASA ADS] [CrossRef] [EDP Sciences] [Google Scholar]
- Astropy Collaboration (Price-Whelan, A. M., et al.) 2018, AJ, 156, 123 [Google Scholar]
- Bacon, R., Accardo, M., Adjali, L., et al. 2010, in Ground-Based and Airborne Instrumentation for Astronomy III, Proc. SPIE, 7735, 773508 [Google Scholar]
- Bacon, R., Piqueras, L., Conseil, S., Richard, J., & Shepherd, M. 2016, Astrophysics Source Code Library [record ascl:1611.003] [Google Scholar]
- Beasley, M. A., & Trujillo, I. 2016, ApJ, 830, 23 [CrossRef] [Google Scholar]
- Bellazzini, M., Belokurov, V., Magrini, L., et al. 2017, MNRAS, 467, 3751 [NASA ADS] [Google Scholar]
- Benavides, J. A., Sales, L. V., Abadi, M. G., et al. 2023, MNRAS, 522, 1033 [NASA ADS] [CrossRef] [Google Scholar]
- Benavides, J. A., Sales, L. V., Abadi, M. G., et al. 2024, ApJ, 977, 169 [NASA ADS] [CrossRef] [Google Scholar]
- Bennet, P., Sand, D. J., Zaritsky, D., et al. 2018, ApJ, 866, L11 [NASA ADS] [CrossRef] [Google Scholar]
- Bradley, L., Sipőcz, B., Robitaille, T., et al. 2023, https://doi.org/10.5281/zenodo.7946442 [Google Scholar]
- Buttitta, C., Iodice, E., Doll, G., et al. 2025, A&A, 694, A276 [NASA ADS] [CrossRef] [EDP Sciences] [Google Scholar]
- Buzzo, M. L., Forbes, D. A., Brodie, J. P., et al. 2022, MNRAS, 517, 2231 [NASA ADS] [CrossRef] [Google Scholar]
- Buzzo, M. L., Forbes, D. A., Jarrett, T. H., et al. 2024a, MNRAS, 529, 3210 [NASA ADS] [CrossRef] [Google Scholar]
- Buzzo, M. L., Forbes, D. A., Jarrett, T. H., et al. 2024b, MNRAS, 536, 2536 [Google Scholar]
- Cappellari, M. 2017, MNRAS, 466, 798 [Google Scholar]
- Cappellari, M. 2023, MNRAS, 526, 3273 [NASA ADS] [CrossRef] [Google Scholar]
- Cappellari, M., Emsellem, E., Krajnović, D., et al. 2011, MNRAS, 413, 813 [Google Scholar]
- Chilingarian, I. V., Afanasiev, A. V., Grishin, K. A., Fabricant, D., & Moran, S. 2019, ApJ, 884, 79 [NASA ADS] [CrossRef] [Google Scholar]
- Christlein, D., & Zabludoff, A. I. 2003, ApJ, 591, 764 [Google Scholar]
- Collins, M. L. M., Tollerud, E. J., Rich, R. M., et al. 2020, MNRAS, 491, 3496 [NASA ADS] [CrossRef] [Google Scholar]
- Danieli, S., van Dokkum, P., Conroy, C., Abraham, R., & Romanowsky, A. J. 2019, ApJ, 874, L12 [NASA ADS] [CrossRef] [Google Scholar]
- Danieli, S., van Dokkum, P., Trujillo-Gomez, S., et al. 2022, ApJ, 927, L28 [NASA ADS] [CrossRef] [Google Scholar]
- Di Cintio, A., Brook, C. B., Dutton, A. A., et al. 2017, MNRAS, 466, L1 [NASA ADS] [CrossRef] [Google Scholar]
- Fensch, J., van der Burg, R. F. J., Jeřábková, T., et al. 2019, A&A, 625, A77 [NASA ADS] [CrossRef] [EDP Sciences] [Google Scholar]
- Ferré-Mateu, A., Sánchez-Blázquez, P., Vazdekis, A., & de la Rosa, I. G. 2014, ApJ, 797, 136 [CrossRef] [Google Scholar]
- Ferré-Mateu, A., Alabi, A., Forbes, D. A., et al. 2018, MNRAS, 479, 4891 [CrossRef] [Google Scholar]
- Ferré-Mateu, A., Gannon, J. S., Forbes, D. A., et al. 2023, MNRAS, 526, 4735 [CrossRef] [Google Scholar]
- Forbes, D. A., & Gannon, J. 2024, MNRAS, 528, 608 [NASA ADS] [CrossRef] [Google Scholar]
- Forbes, D. A., Read, J. I., Gieles, M., & Collins, M. L. M. 2018, MNRAS, 481, 5592 [NASA ADS] [CrossRef] [Google Scholar]
- Forbes, D. A., Gannon, J., Couch, W. J., et al. 2019, A&A, 626, A66 [NASA ADS] [CrossRef] [EDP Sciences] [Google Scholar]
- Forbes, D. A., Gannon, J. S., Romanowsky, A. J., et al. 2021, MNRAS, 500, 1279 [Google Scholar]
- Forbes, D. A., Gannon, J., Iodice, E., et al. 2023, MNRAS, 525, L93 [NASA ADS] [CrossRef] [Google Scholar]
- Gannon, J. S., Forbes, D. A., Romanowsky, A. J., et al. 2020, MNRAS, 495, 2582 [NASA ADS] [CrossRef] [Google Scholar]
- Gannon, J. S., Dullo, B. T., Forbes, D. A., et al. 2021, MNRAS, 502, 3144 [Google Scholar]
- Gannon, J. S., Forbes, D. A., Romanowsky, A. J., et al. 2022, MNRAS, 510, 946 [Google Scholar]
- Gannon, J. S., Forbes, D. A., Brodie, J. P., et al. 2023, MNRAS, 518, 3653 [Google Scholar]
- Gannon, J. S., Ferré-Mateu, A., Forbes, D. A., et al. 2024, MNRAS, 531, 1856 [NASA ADS] [CrossRef] [Google Scholar]
- Grèbol-Tomàs, P., Ferré-Mateu, A., & Domínguez-Sánchez, H. 2023, MNRAS, 526, 4024 [CrossRef] [Google Scholar]
- Gu, M., Conroy, C., Law, D., et al. 2018, ApJ, 859, 37 [Google Scholar]
- Hartke, J., Iodice, E., Gullieuszik, M., et al. 2025, A&A, 695, A91 [NASA ADS] [CrossRef] [EDP Sciences] [Google Scholar]
- Heesters, N., Müller, O., Marleau, F. R., et al. 2023, A&A, 676, A33 [NASA ADS] [CrossRef] [EDP Sciences] [Google Scholar]
- Huang, K.-W., & Koposov, S. E. 2021, MNRAS, 500, 986 [Google Scholar]
- Hunter, J. D. 2007, Comput. Sci. Eng., 9, 90 [NASA ADS] [CrossRef] [Google Scholar]
- Iodice, E., Cantiello, M., Hilker, M., et al. 2020, A&A, 642, A48 [EDP Sciences] [Google Scholar]
- Iodice, E., La Marca, A., Hilker, M., et al. 2021, A&A, 652, L11 [NASA ADS] [CrossRef] [EDP Sciences] [Google Scholar]
- Iodice, E., Hilker, M., Doll, G., et al. 2023, A&A, 679, A69 [NASA ADS] [CrossRef] [EDP Sciences] [Google Scholar]
- Janssens, S., Abraham, R., Brodie, J., et al. 2017, ApJ, 839, L17 [NASA ADS] [CrossRef] [Google Scholar]
- Janssens, S. R., Romanowsky, A. J., Abraham, R., et al. 2022, MNRAS, 517, 858 [NASA ADS] [CrossRef] [Google Scholar]
- Ji, A. P., Koposov, S. E., Li, T. S., et al. 2021, ApJ, 921, 32 [CrossRef] [Google Scholar]
- Karachentsev, I. D., Makarova, L. N., Sharina, M. E., & Karachentseva, V. E. 2017, Astrophys. Bull., 72, 376 [NASA ADS] [CrossRef] [Google Scholar]
- Kirby, E. N., Cohen, J. G., Guhathakurta, P., et al. 2013, ApJ, 779, 102 [Google Scholar]
- Knowles, A. T., Sansom, A. E., Vazdekis, A., & Allende Prieto, C. 2023, MNRAS, 523, 3450 [NASA ADS] [CrossRef] [Google Scholar]
- Koda, J., Yagi, M., Yamanoi, H., & Komiyama, Y. 2015, ApJ, 807, L2 [NASA ADS] [CrossRef] [Google Scholar]
- La Marca, A., Iodice, E., Cantiello, M., et al. 2022, A&A, 665, A105 [NASA ADS] [CrossRef] [EDP Sciences] [Google Scholar]
- Lee, J. H., Kang, J., Lee, M. G., & Jang, I. S. 2020, ApJ, 894, 75 [NASA ADS] [CrossRef] [Google Scholar]
- Leisman, L., Haynes, M. P., Janowiecki, S., et al. 2017, ApJ, 842, 133 [NASA ADS] [CrossRef] [Google Scholar]
- Levitskiy, A., Forbes, D. A., Gannon, J. S., et al. 2025, MNRAS, 541, 2761 [Google Scholar]
- Lim, S., Peng, E. W., Côté, P., et al. 2018, ApJ, 862, 82 [Google Scholar]
- Lim, S., Côté, P., Peng, E. W., et al. 2020, ApJ, 899, 69 [CrossRef] [Google Scholar]
- Ma, X., Hopkins, P. F., Faucher-Giguère, C.-A., et al. 2016, MNRAS, 456, 2140 [NASA ADS] [CrossRef] [Google Scholar]
- Mancera Piña, P. E., Peletier, R. F., Aguerri, J. A. L., et al. 2018, MNRAS, 481, 4381 [Google Scholar]
- Martin, N. F., Ibata, R. A., Lewis, G. F., et al. 2016, ApJ, 833, 167 [NASA ADS] [CrossRef] [Google Scholar]
- Martin, G., Kaviraj, S., Laigle, C., et al. 2019, MNRAS, 485, 796 [NASA ADS] [CrossRef] [Google Scholar]
- Martínez-Delgado, D., Läsker, R., Sharina, M., et al. 2016, AJ, 151, 96 [CrossRef] [Google Scholar]
- McConnachie, A. W. 2012, AJ, 144, 4 [Google Scholar]
- Mihos, C. 2015, IAU Gen. Assem., 22, 2247903 [NASA ADS] [Google Scholar]
- Mihos, J. C., Durrell, P. R., Toloba, E., et al. 2022, ApJ, 924, 87 [Google Scholar]
- Mirabile, M., Cantiello, M., Rejkuba, M., et al. 2026, A&A, 705, A117 [NASA ADS] [CrossRef] [EDP Sciences] [Google Scholar]
- Mistani, P. A., Sales, L. V., Pillepich, A., et al. 2015, MNRAS, 455, 2323 [Google Scholar]
- Müller, O., Rich, R. M., Román, J., et al. 2019, A&A, 624, L6 [Google Scholar]
- Müller, O., Marleau, F. R., Duc, P.-A., et al. 2020, A&A, 640, A106 [Google Scholar]
- Müller, O., Durrell, P. R., Marleau, F. R., et al. 2021, ApJ, 923, 9 [CrossRef] [Google Scholar]
- Ogiya, G. 2018, MNRAS, 480, L106 [NASA ADS] [CrossRef] [Google Scholar]
- Peng, E. W., & Lim, S. 2016, ApJ, 822, L31 [NASA ADS] [CrossRef] [Google Scholar]
- Piqueras, L., Conseil, S., Shepherd, M., et al. 2017, arXiv e-prints [arXiv:1710.03554] [Google Scholar]
- Poggianti, B. M., Gullieuszik, M., Tonnesen, S., et al. 2019, MNRAS, 482, 4466 [Google Scholar]
- Prole, D. J., van der Burg, R. F. J., Hilker, M., & Davies, J. I. 2019, MNRAS, 488, 2143 [NASA ADS] [Google Scholar]
- Rhee, J., Smith, R., Choi, H., et al. 2017, ApJ, 843, 128 [Google Scholar]
- Román, J., & Trujillo, I. 2017, MNRAS, 468, 703 [CrossRef] [Google Scholar]
- Romero-Gómez, J., Peletier, R. F., Aguerri, J. A. L., et al. 2023, MNRAS, 522, 130 [CrossRef] [Google Scholar]
- Rong, Y., Guo, Q., Gao, L., et al. 2017, MNRAS, 470, 4231 [Google Scholar]
- Ruiz-Lara, T., Beasley, M. A., Falcón-Barroso, J., et al. 2018, MNRAS, 478, 2034 [NASA ADS] [CrossRef] [Google Scholar]
- Saifollahi, T., Zaritsky, D., Trujillo, I., et al. 2022, MNRAS, 511, 4633 [NASA ADS] [CrossRef] [Google Scholar]
- Sales, L. V., Navarro, J. F., Peñafiel, L., et al. 2020, MNRAS, 494, 1848 [Google Scholar]
- Sandage, A., & Binggeli, B. 1984, AJ, 89, 919 [Google Scholar]
- Shen, Z., Danieli, S., van Dokkum, P., et al. 2021, ApJ, 914, L12 [NASA ADS] [CrossRef] [Google Scholar]
- Shen, Z., van Dokkum, P., & Danieli, S. 2023, ApJ, 957, 6 [NASA ADS] [CrossRef] [Google Scholar]
- Soto, K. T., Lilly, S. J., Bacon, R., Richard, J., & Conseil, S. 2016, MNRAS, 458, 3210 [Google Scholar]
- Spavone, M., Iodice, E., Lohmann, F. S., et al. 2024, A&A, 689, A306 [NASA ADS] [CrossRef] [EDP Sciences] [Google Scholar]
- Toloba, E., Lim, S., Peng, E., et al. 2018, ApJ, 856, L31 [CrossRef] [Google Scholar]
- Toloba, E., Sales, L. V., Lim, S., et al. 2023, ApJ, 951, 77 [NASA ADS] [CrossRef] [Google Scholar]
- Torrealba, G., Belokurov, V., Koposov, S. E., et al. 2019, MNRAS, 488, 2743 [NASA ADS] [CrossRef] [Google Scholar]
- Tremmel, M., Wright, A. C., Brooks, A. M., et al. 2020, MNRAS, 497, 2786 [Google Scholar]
- Trujillo, I., Roman, J., Filho, M., & Sánchez Almeida, J. 2017, ApJ, 836, 191 [NASA ADS] [CrossRef] [Google Scholar]
- van der Burg, R. F. J., Muzzin, A., & Hoekstra, H. 2016, A&A, 590, A20 [NASA ADS] [CrossRef] [EDP Sciences] [Google Scholar]
- van der Walt, S., Colbert, S. C., & Varoquaux, G. 2011, Comput. Sci. Eng., 13, 22 [Google Scholar]
- van Dokkum, P. G., Romanowsky, A. J., Abraham, R., et al. 2015, ApJ, 804, L26 [NASA ADS] [CrossRef] [Google Scholar]
- van Dokkum, P., Abraham, R., Brodie, J., et al. 2016, ApJ, 828, L6 [Google Scholar]
- van Dokkum, P., Abraham, R., Romanowsky, A. J., et al. 2017, ApJ, 844, L11 [NASA ADS] [CrossRef] [Google Scholar]
- van Dokkum, P., Danieli, S., Cohen, Y., et al. 2018, Nature, 555, 629 [Google Scholar]
- van Dokkum, P., Wasserman, A., Danieli, S., et al. 2019, ApJ, 880, 91 [Google Scholar]
- Van Nest, J. D., Munshi, F., Wright, A. C., et al. 2022, ApJ, 926, 92 [NASA ADS] [CrossRef] [Google Scholar]
- Vazdekis, A., Coelho, P., Cassisi, S., et al. 2015, MNRAS, 449, 1177 [Google Scholar]
- Vazdekis, A., Koleva, M., Ricciardelli, E., Röck, B., & Falcón-Barroso, J. 2016, MNRAS, 463, 3409 [Google Scholar]
- Villaume, A., Romanowsky, A. J., Brodie, J., et al. 2022, ApJ, 924, 32 [Google Scholar]
- Virtanen, P., Gommers, R., Oliphant, T. E., et al. 2020, Nat. Methods, 17, 261 [Google Scholar]
- Webb, K. A., Villaume, A., Laine, S., et al. 2022, MNRAS, 516, 3318 [NASA ADS] [CrossRef] [Google Scholar]
- Worthey, G., Faber, S. M., & Gonzalez, J. J. 1992, ApJ, 398, 69 [Google Scholar]
- Yagi, M., Koda, J., Komiyama, Y., & Yamanoi, H. 2016, ApJS, 225, 11 [CrossRef] [Google Scholar]
- Yozin, C., & Bekki, K. 2015, MNRAS, 452, 937 [NASA ADS] [CrossRef] [Google Scholar]
- Zaritsky, D., & Behroozi, P. 2023, MNRAS, 519, 871 [Google Scholar]
Spectroscopic data are not available for the sample of dwarf galaxies in Hydra I cluster.
Appendix A: Line indices
In this section, we show the model grids used for the computation of the [Mg/Fe] pattern and address the potential caveats of using the standard E-MILES models.
Fig. A.1 shows a selection of sMILES model grids for all galaxies in our high-quality sample: for each one, we restrict the age and metallicity of each grid to a region centred at the ppxf solution of the galaxy for both their age and metallicity. Comparing the data points to an interpolated (or extrapolated) trend for the grid, we compute an estimate of [Mg/Fe].
The top panel of Fig. A.2 shows our data points on top of the E-MILES models. The bottom panel shows the actual model grids (E-MILES+ppxf) to derive the [Mg/Fe] pattern, using light-weighted ages as a more robust age indicator. We note that E-MILES templates are not being used for any ppxf fits and are solely to have another, partly independent measurement of the α-enhancement. We strictly use variable [α/Fe] sMILES templates, as these allow us to cover a larger space in the Hβ0 distribution and therefore to minimise any effect of template mismatch. We caution that two sources have an extremely low Hβ0 intensity and are not perfectly covered by any template (UDG9 and UDG12). However, the strength of the metallic lines allows us to still constrain the metallicity and alpha content of these galaxies via the α-enhanced sMILES templates. The age, though in a difficult position, can be constrained by the use of ppxf. We interpret the positioning of these sources within the grids as the effect of high levels of [α/Fe], low S/N and a possible, minor emission component, hard to decouple given the quality of these spectra. Overall, we find the results for the [Mg/Fe] computation are fully consistent between the three methods (ppxf-derived, E-MILES derived, and sMILES-derived). Three minor exceptions are found: UDG1, LSB5 and LSB8 have an extremely low α-enhancement, going slightly beyond the template limits at the low end with the sMILES method (Fig. A.1) and are at the corners of the grid following the method of Vazdekis et al. (2015) and Ferré-Mateu et al. (2023) using the E-MILES templates (Fig. A.2). Thus, we are forced to slightly extrapolate outside the model grids for their computation, as the sMILES models (and thus, their ppxf results) have a hard limit at a sub-solar enhancement of −0.2 dex.
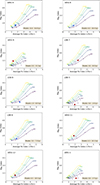 |
Fig. A.1. Line indices ⟨Fe⟩ and ⟨Mgb⟩ for sMILES models and LEWIS galaxies. In each panel, the label indicates the subset of sMILES models (coloured lines and circles) restricted in age and metallicity used to compute line indices and infer the values of [Mg/Fe] for the LEWIS galaxies, colour-coded as in Fig. 1. |
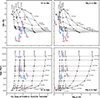 |
Fig. A.2. Top row: E-MILES base models compared to line indices data points from our sample. Bottom row: E-MILES model grids used to compute the [Mg/Fe] enhancement, using the light-weighted age of the models and ppxf to make the grids orthogonal, and this is better defined in the old and metal-poor regime. LEWIS galaxies are colour-coded as in Fig. 1 |
Appendix B: Stellar population properties and star formation histories
In this section, we present the stellar population properties and SFHs of all the galaxies in LEWIS for which both stellar kinematics and stellar population properties are accurately constrained (see Section 4). Figs.B.1 to B.10 reports the ppxf fit of the analysed spectral region for the different galaxies, along with a grid showing the median distribution of ages and metallicities obtained through our Monte Carlo procedure. Additionally, we include the cumulative mass fraction obtained by collapsing the age and metallicity weights of each Monte Carlo iteration.
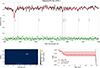 |
Fig. B.1. Stellar population properties and SFH of UDG1. Top panel: MUSE 1 Re stacked spectrum (solid black line) for UDG1. The main absorption features are marked in purple. The solid red line represents the best fit obtained with ppxf. The green points denote the residuals between the observed spectrum and its best-fit template spectrum. The grey areas indicate the masked regions excluded from the fit. Bottom left panel: Age-metallicity distribution of the MC iterations of UDG1. Bottom right panel: Cumulative mass fraction, based on the MC iterations. t50 marks the time at which 50% of the galaxy mass was formed. |
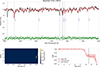 |
Fig. B.10. Same as Fig. B.1, but for LSB8. |
Appendix C: Intermediate cases
In this section, we describe the intermediate cases, i.e. galaxies classified with ‘I’ symbol in Table 1. These galaxies have spectra with insufficient S/N to properly resolve all major absorption features. In addition, the stellar kinematics extraction might be biased and thus affect the reliability of the results from stellar population analysis. These galaxies are UDG3, UDG7, UDG10, LSB1, and LSB4. The spectrum of UDG3 presents a very weak Hβ and lacks any major hint of iron and/or magnesium lines. We thus infer that this source is presumably old, as most of the sample. However, we cannot put a constraint on the exact age or metal content. The same holds for LSB1 and LSB4. The spectra of UDG7 and UDG10, instead, show clear Fe lines, but the poor quality of the Hβ feature makes the degeneracy of the α-enhancement and metallicity hard to break. The large [Mg/Fe] ratio of UDG7 would place this galaxy among the highest α-enhanced sources in the sample, as their iron patterns fall outside of solar-scaled model templates. We infer that UDG7 and UDG10 are old and enhanced in magnesium content, yet the large uncertainties and degeneracies due to the data quality make it hard to give significant constraints.
All Tables
All Figures
|
Fig. 1. Stellar population properties of LEWIS galaxies. Left panel: Mean mass-weighted ages as a function of metallicities [M/H] for the LEWIS sample (coloured data points) and the literature UDGs (green circles, from Ferré-Mateu et al. 2023). The red and blue circles represent galaxies classified as very early and late infallers, respectively. Right panel: Chemical abundance [α/Fe] as a function of metallicities [M/H]. Data points are colour-coded as in the left panel. |
| In the text | |
|
Fig. 2. Mass-metallicity relation. LEWIS data points are colour-coded as in Fig. 1, while other coloured data points correspond to literature samples: UDGs in clusters (light green circles) and in low-density environments (dark green diamonds) from Ferré-Mateu et al. (2023), UDGs in low-density environments (violet circles) from Buzzo et al. (2024a), and UDGs and nearly UDGs in high-density environments (violet diamonds) from Buzzo et al. (2024b). The solid black line represents the mass-metallicity relation found for dwarf galaxies, assuming a constant α-enhancement (Kirby et al. 2013), and the dashed grey lines represent the 1σ and 2σ confidence regions of the relation. The yellow line represents the evolving mass-metallicity relationship at redshift z ∼ 2.2 from Ma et al. (2016). |
| In the text | |
|
Fig. 3. SFHs of LEWIS galaxies: Very early quenching (t50 > 13 Gyr, upper panels) vs. normal to late quenching (t50 < 13 Gyr, lower panels). Lines are colour-coded as in Fig. 1, separating very early and late infallers. In each panel, the thin lines represent the individual SFHs of galaxies, whereas the thick solid line represents the median SFH. The grey lines represent the percentiles t50 and t90 of the mean SFHs. |
| In the text | |
|
Fig. 4. Global properties of LEWIS galaxies as a function of the cluster environment. The PPS diagram shows the relative velocity versus the projected radius for the LEWIS sample (coloured points), and galaxies from Christlein & Zabludoff (2003) catalogue (white circles). LEWIS galaxies are colour-coded according to the stellar mass (top-left panel), metallicity (top-right panel), chemical abundance (lower-left panel), and presence of rotation (lower-right panel). The shaded grey regions indicate different infall stages (Rhee et al. 2017; Forbes et al. 2023): early infall (dark grey) and late infall (light grey). |
| In the text | |
|
Fig. 5. Velocity dispersion measurements as a function of alpha abundances. LEWIS galaxies are colour-coded as in Fig. 1. Green triangles are UDGs analysed by Ferré-Mateu et al. (2023). Values of σeff for LEWIS are from Paper II. The dashed black line and the corresponding shaded region represent the average trend of massive early-type galaxies from ATLAS3D survey (Cappellari et al. 2011). The light blue line and the corresponding shaded region represent the average trend ATLAS3D survey together with the sample of dwarf galaxies in the Fornax cluster from the SAMI survey (Romero-Gómez et al. 2023). |
| In the text | |
|
Fig. 6. SFHs of LEWIS galaxies and stellar kinematics properties. Galaxies are separated according to the kinematic type as described in Paper II: Presence of rotation (left panel) vs. non-rotating objects (right panel). Thick solid lines correspond to the average SFH for each panel, and shaded lines correspond to the standard deviation of the distribution. Similarly to Fig. 3, the grey lines correspond to t50 and t90, respectively. |
| In the text | |
|
Fig. A.1. Line indices ⟨Fe⟩ and ⟨Mgb⟩ for sMILES models and LEWIS galaxies. In each panel, the label indicates the subset of sMILES models (coloured lines and circles) restricted in age and metallicity used to compute line indices and infer the values of [Mg/Fe] for the LEWIS galaxies, colour-coded as in Fig. 1. |
| In the text | |
|
Fig. A.2. Top row: E-MILES base models compared to line indices data points from our sample. Bottom row: E-MILES model grids used to compute the [Mg/Fe] enhancement, using the light-weighted age of the models and ppxf to make the grids orthogonal, and this is better defined in the old and metal-poor regime. LEWIS galaxies are colour-coded as in Fig. 1 |
| In the text | |
|
Fig. B.1. Stellar population properties and SFH of UDG1. Top panel: MUSE 1 Re stacked spectrum (solid black line) for UDG1. The main absorption features are marked in purple. The solid red line represents the best fit obtained with ppxf. The green points denote the residuals between the observed spectrum and its best-fit template spectrum. The grey areas indicate the masked regions excluded from the fit. Bottom left panel: Age-metallicity distribution of the MC iterations of UDG1. Bottom right panel: Cumulative mass fraction, based on the MC iterations. t50 marks the time at which 50% of the galaxy mass was formed. |
| In the text | |
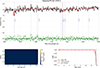 |
Fig. B.2. Same as Fig. B.1, but for UDG4. |
| In the text | |
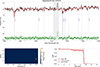 |
Fig. B.3. Same as Fig. B.1, but for UDG8. |
| In the text | |
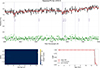 |
Fig. B.4. Same as Fig. B.1, but for UDG9. |
| In the text | |
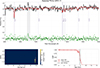 |
Fig. B.5. Same as Fig. B.1, but for UDG11. |
| In the text | |
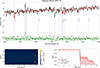 |
Fig. B.6. Same as Fig. B.1, but for UDG12. |
| In the text | |
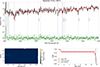 |
Fig. B.7. Same as Fig. B.1, but for LSB5. |
| In the text | |
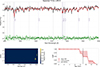 |
Fig. B.8. Same as Fig. B.1, but for LSB6. |
| In the text | |
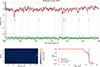 |
Fig. B.9. Same as Fig. B.1, but for LSB7. |
| In the text | |
|
Fig. B.10. Same as Fig. B.1, but for LSB8. |
| In the text | |
Current usage metrics show cumulative count of Article Views (full-text article views including HTML views, PDF and ePub downloads, according to the available data) and Abstracts Views on Vision4Press platform.
Data correspond to usage on the plateform after 2015. The current usage metrics is available 48-96 hours after online publication and is updated daily on week days.
Initial download of the metrics may take a while.